Climate Stations Deployment
The currently used sensors are from Fine Offset Electronics and in Nature 40 identical in construction from froggit as the so-called DP series and from ecowitt with the original series identification GW-1000.
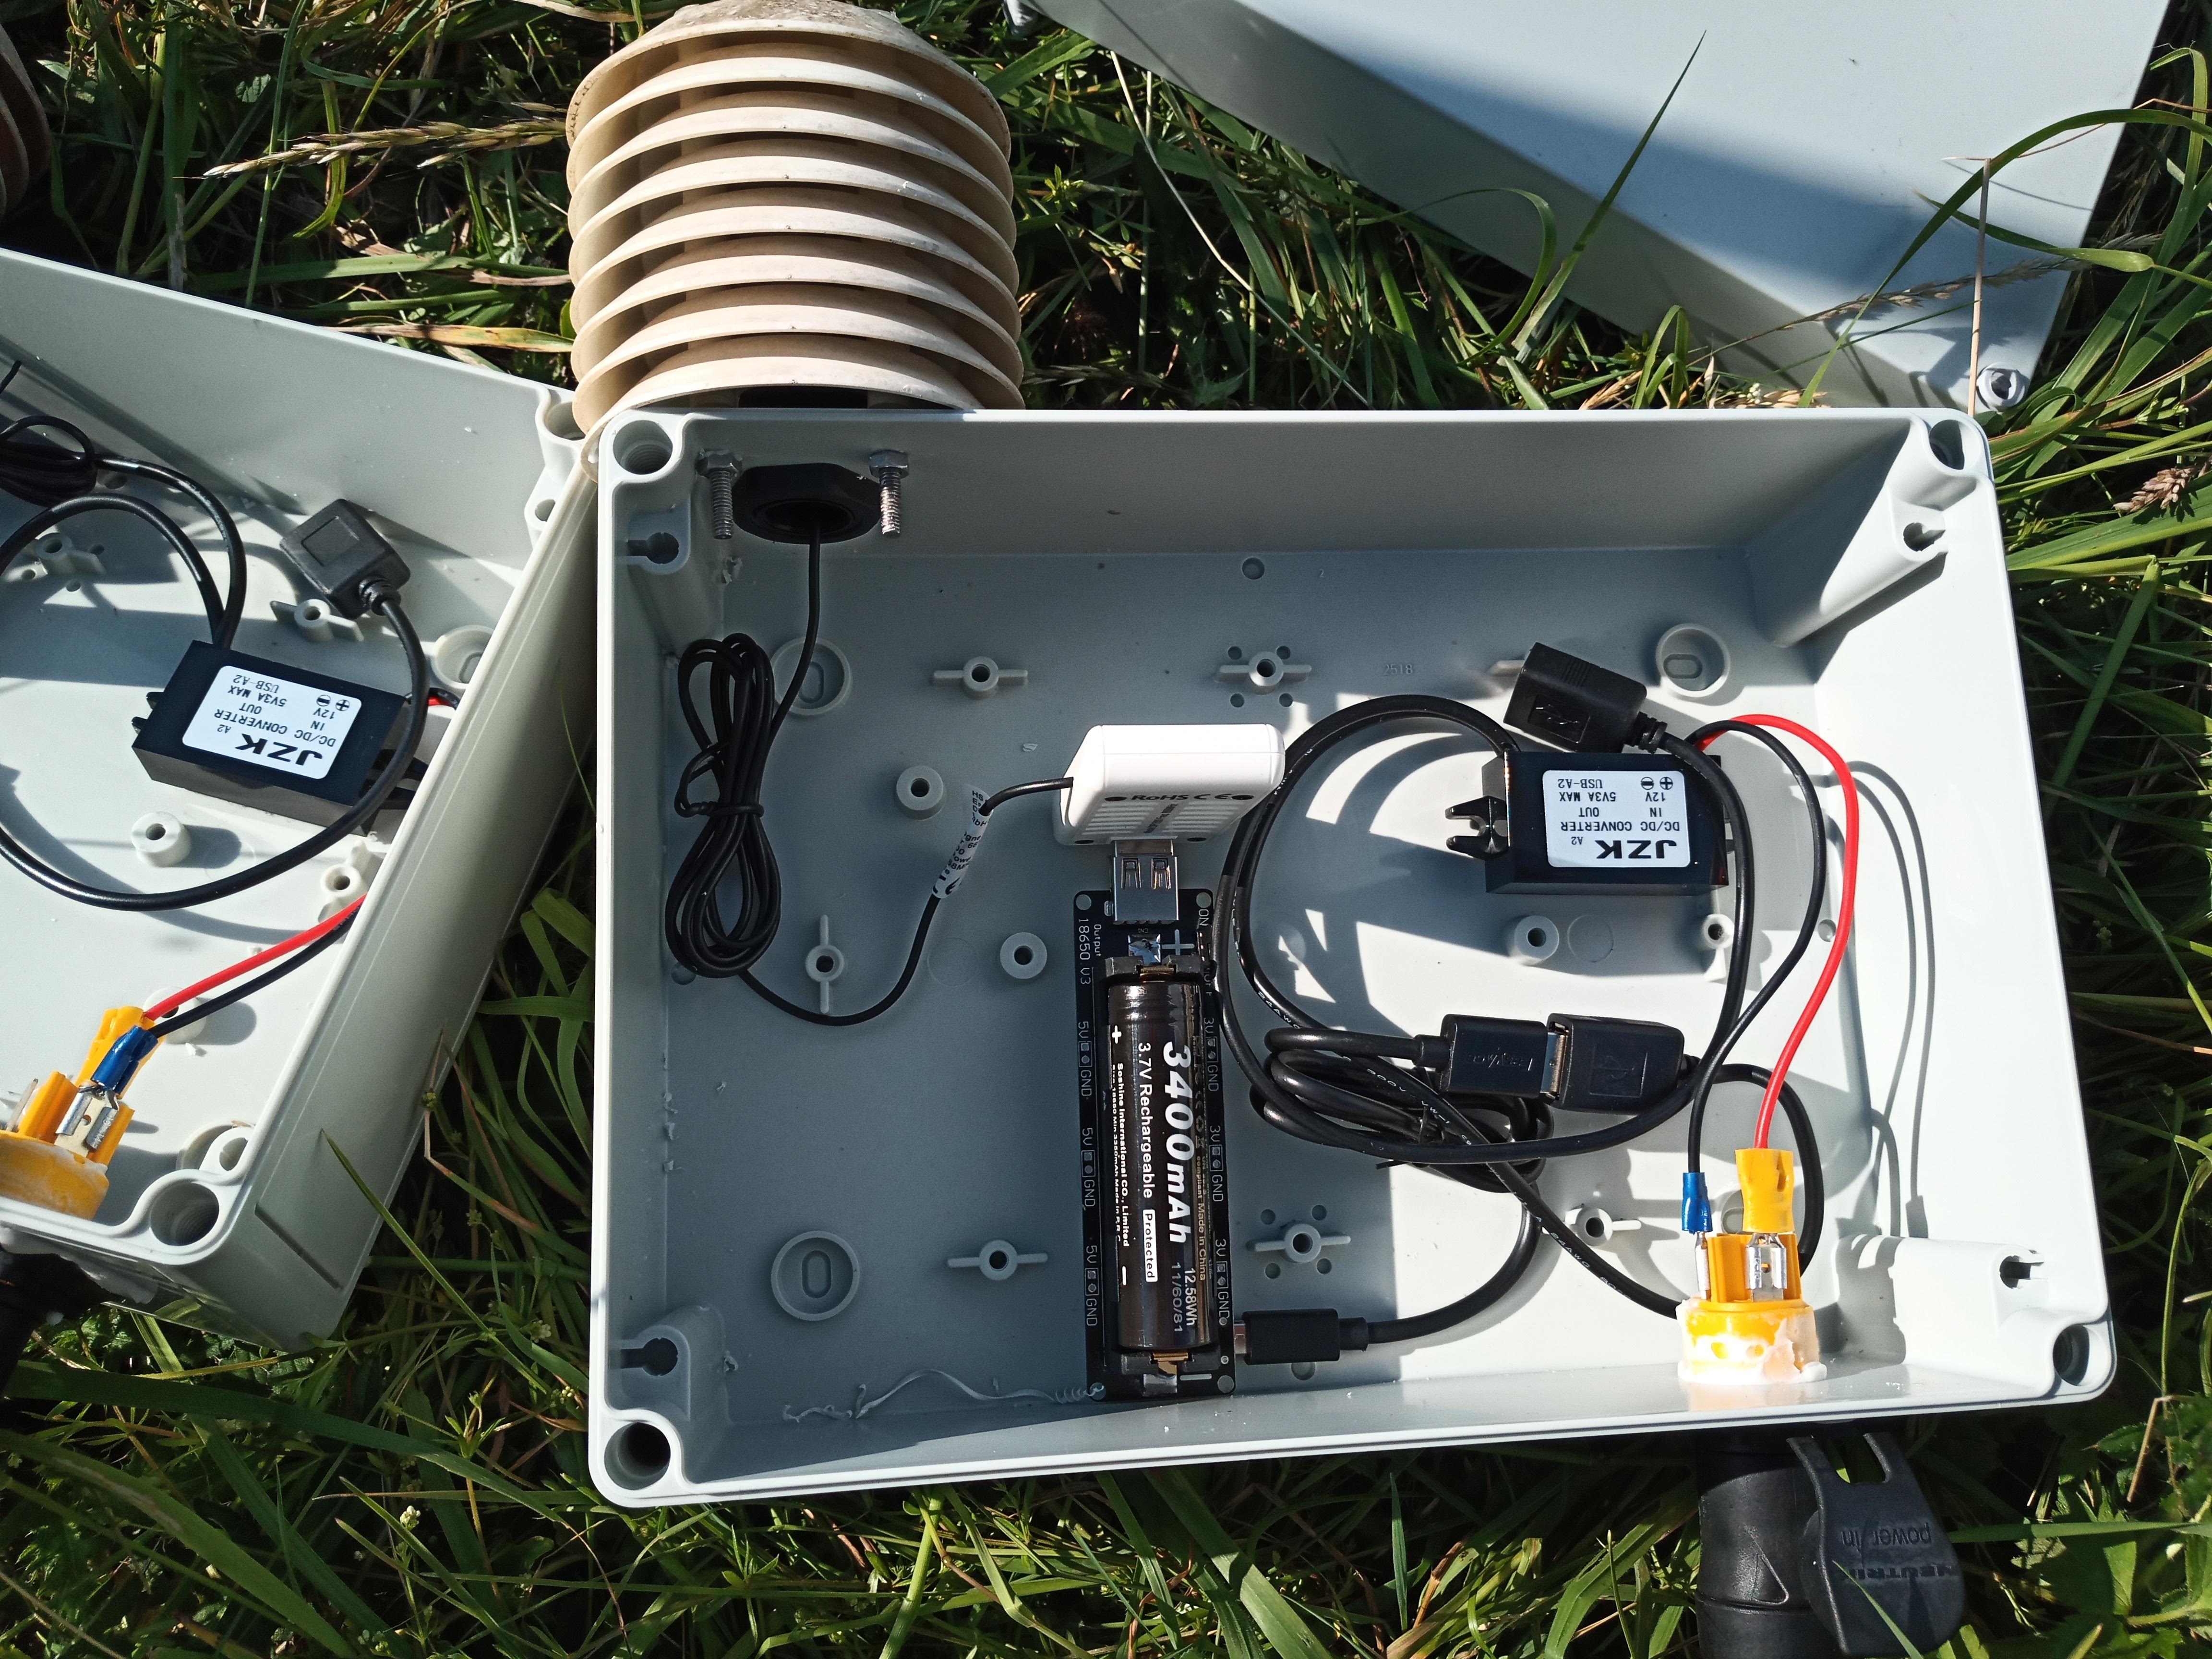
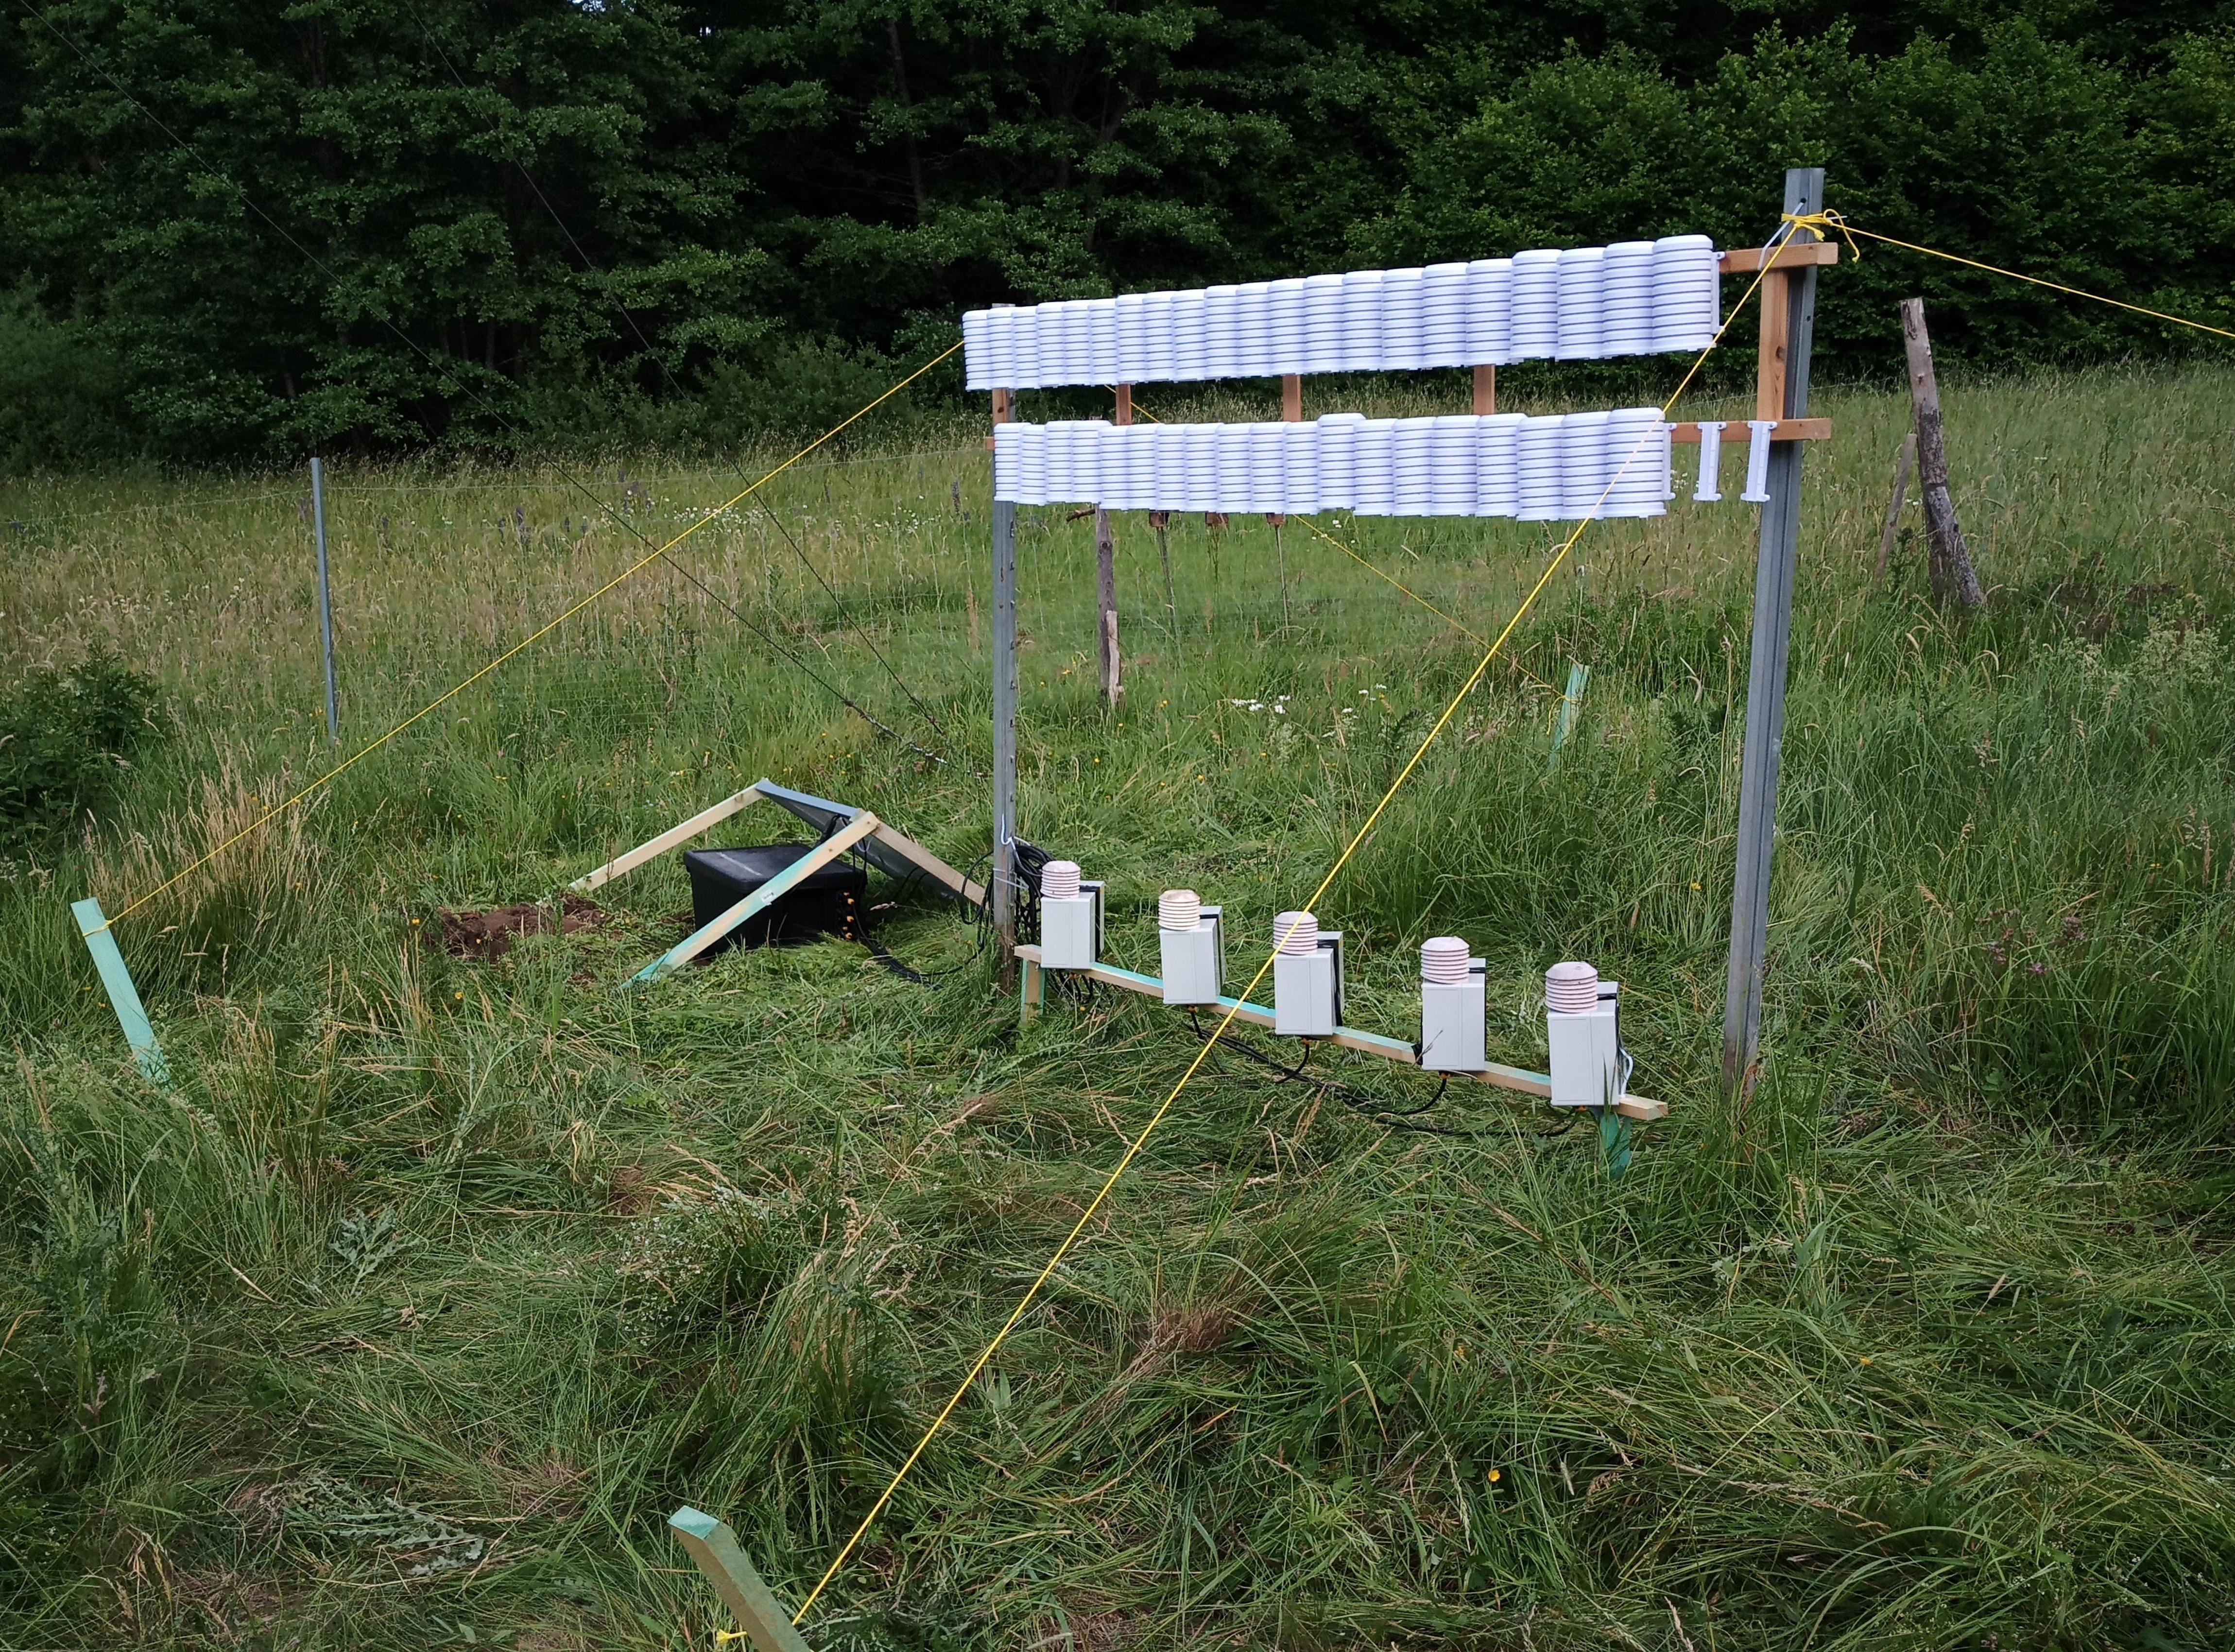
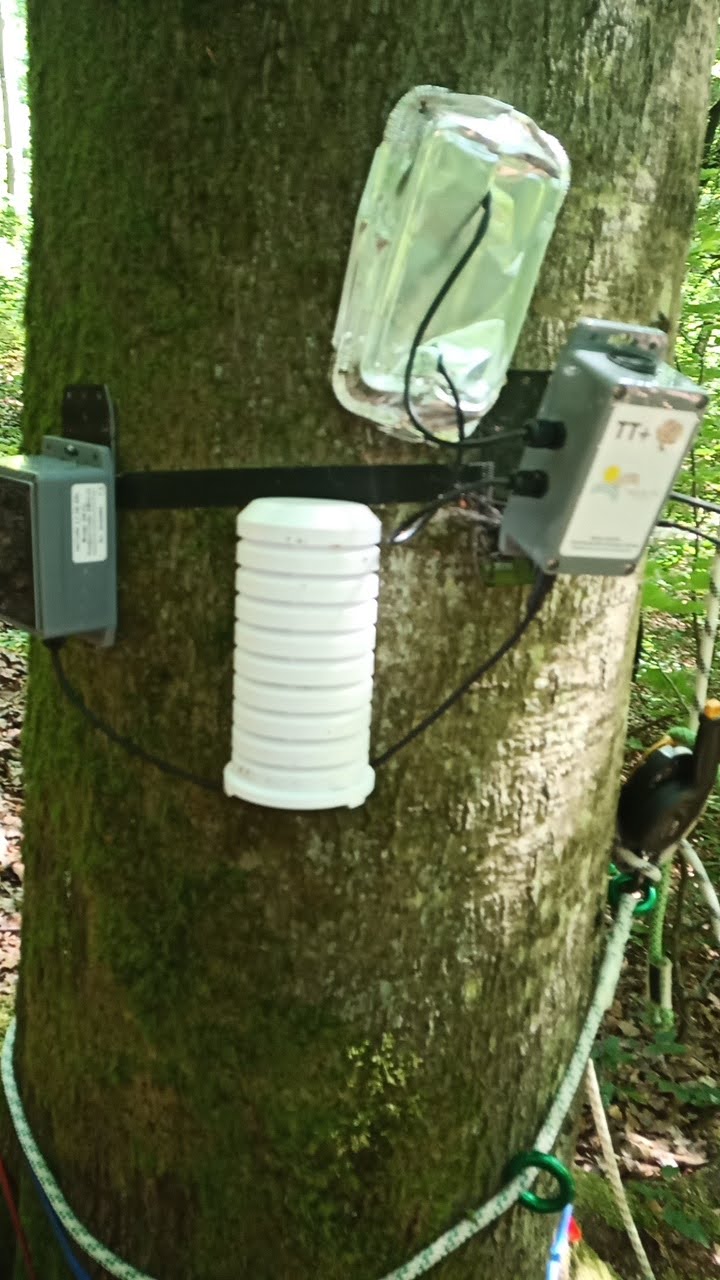
Currently 5 WiFi Hubs with 8 sensors and one base station each are connected via via LoRa radio. The base station is equipped with wind vector, precipitation irradiance and temperature/humidity sensors. The WiFi Hub in turn uses any accessible WLAN to pass on the data in this case via mobile network to a data server.
Sensor Specification
GW1000/DP1500 WiFi hub:
- Frequency: 868Mhz
- Air temperature range: -10°C to +60°C, resolution: 0.1°C, accuracy: +/- 1°C
- Air humidity range: 10% - 99%, Resolution: 1%, accuracy: +/- 5%.
- Air pressure range: 300-1100hPa, resolution: 0.1 hPa, accuracy: +/- 5hPa
- Power supply: USB 5V
DP50 temperature/humidity sensor:
- Frequency: 868Mhz
- Air temperature range: -10°C to +60°C, resolution: 0.1.°C, accuracy: +/- 1°C
- Air humidity range: 10% - 99%, resolution: 1%, accuracy: +/- 5%.
- Transmission interval: 48 seconds
- Power supply: 2 x 1.5V AA batteries
Base Unit:
- Frequency: 868Mhz
- Temperature range: -40°C to +60°C, accuracy: +/- 1°C
- Air humidity range: 10% - 99%, accuracy: +/- 5%
- Precipitation: range 0-9999mm, resolution +/- 0.25mm, accuracy: +/- 10%
- Wind speed: 0-50m/s, accuracy: +/- 3.5 km/h or 10%
- Wind speed/gust calculation every 16 s
- Wind direction accuracy: +/- 1°
- UVI: range: 0 - 15 index, UV accuracy: +/- 15%
- Solar radiation: range 0 - 200k Lux, accuracy +/- 15%
- Measuring interval outdoor unit: 16 seconds
- Power supply: Outdoor unit: 2 x 1.5V AA batteries. The primary energy source is the solar panel. The batteries provide backup power when solar energy is limited.
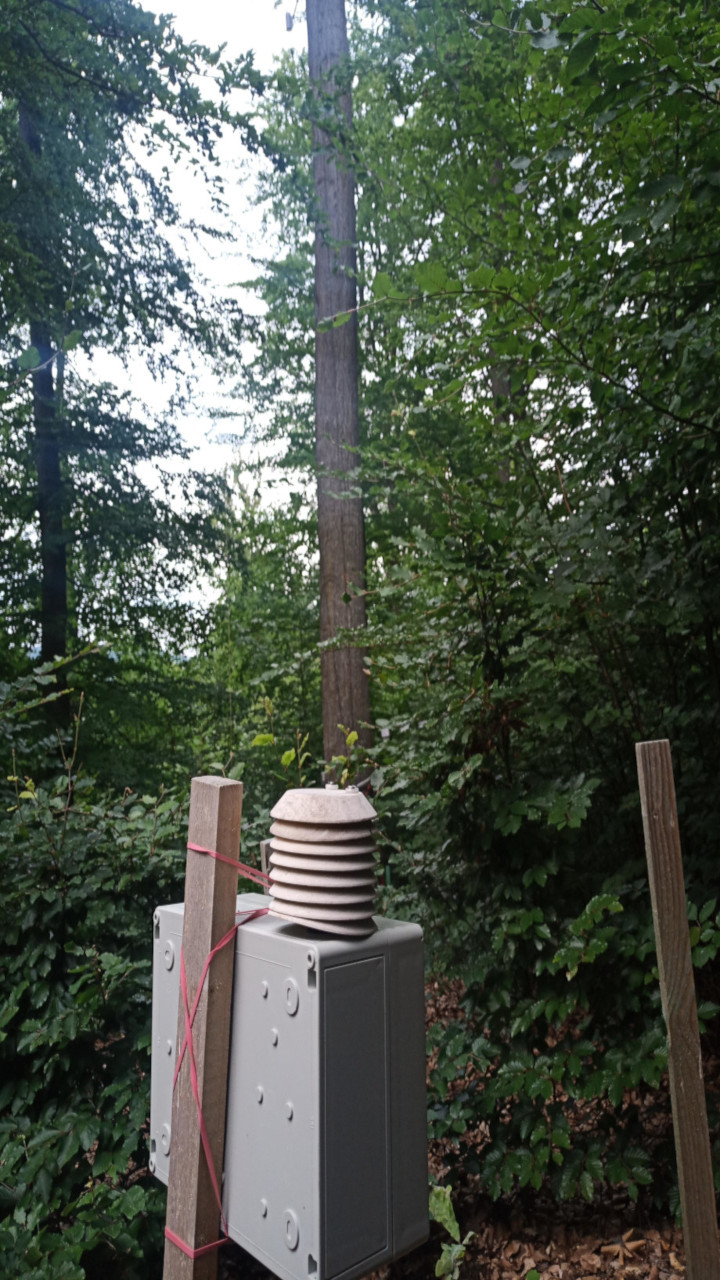
Calibration Concept
The low budget sensors are usually lacking of a stable measurement quality. To obtain reliable micro climate data a two step calibration process is implemented. In a first step the measurements of all sensors will be statistically analysed to identify sensor which produce outliers. In a second step the sensors are calibrated against an operational running high price reference station in the field.
For the future a machine learning approach including the radiation, azimuth, temperature and humidity as predictors for the calibrated temperature as the response variable will be used as an rolling calibration tool.
Channel Assignment and and Station Coding
| HubId | WeatherStationId | BaseID | CH01 | CH02 | CH03 | CH04 | CH05 | CH06 | CH07 | CH08 |
|---|---|---|---|---|---|---|---|---|---|---|
| GW100A-WIFI243E | E5C37C83C2C1EB2C 62BC8FC299D8E281 | 45 | e0 | 20 | 49 | c8 | 42 | eb | 20 | bc |
| level | ground | l7 | l6 | l3 | l4 | l5 | ||||
| GW100A-WIFIF774 | D3E7B46BC773DA5D 0D30F7B94570700F | cc | 40 | 99 | 22 | bb | d | db | 5b | 65 |
| level | ground | tt | l7 | l3 | l2 | l1 | l5 | l6 | l4 | |
| GW100A-WIFIF824 | 64B95BE38E36DB75 ECE69E193C9CFD62 | 2f | 33 | ee | 2d | c0 | fd | f1 | 6e | 7a |
| level | ground | l5 | l2 | l1 | l3 | l6 | l4 | tt | l7 | |
| GW100A-WIFIFB27 | C90B7356EFDA99C5 584B057DA2363EDB | 3e | 3b | b8 | e2 | 4d | 89 | d2 | c3 | d3 |
| level | ground | l7 | l4 | l1 | tt | l2 | l3 | l5 | l6 | |
| GW100A-WIFIFC29 | CC354E3266838432 3E5CB75B8D4A4722 | 7c | f | 8f | 92 | 9c | c | 57 | 53 | 9d |
| level | ground | l7 | l6 | l1 | tt | l4 | l2 | l3 | l5 |
Pre-Calibration
The first calibration step is completed.
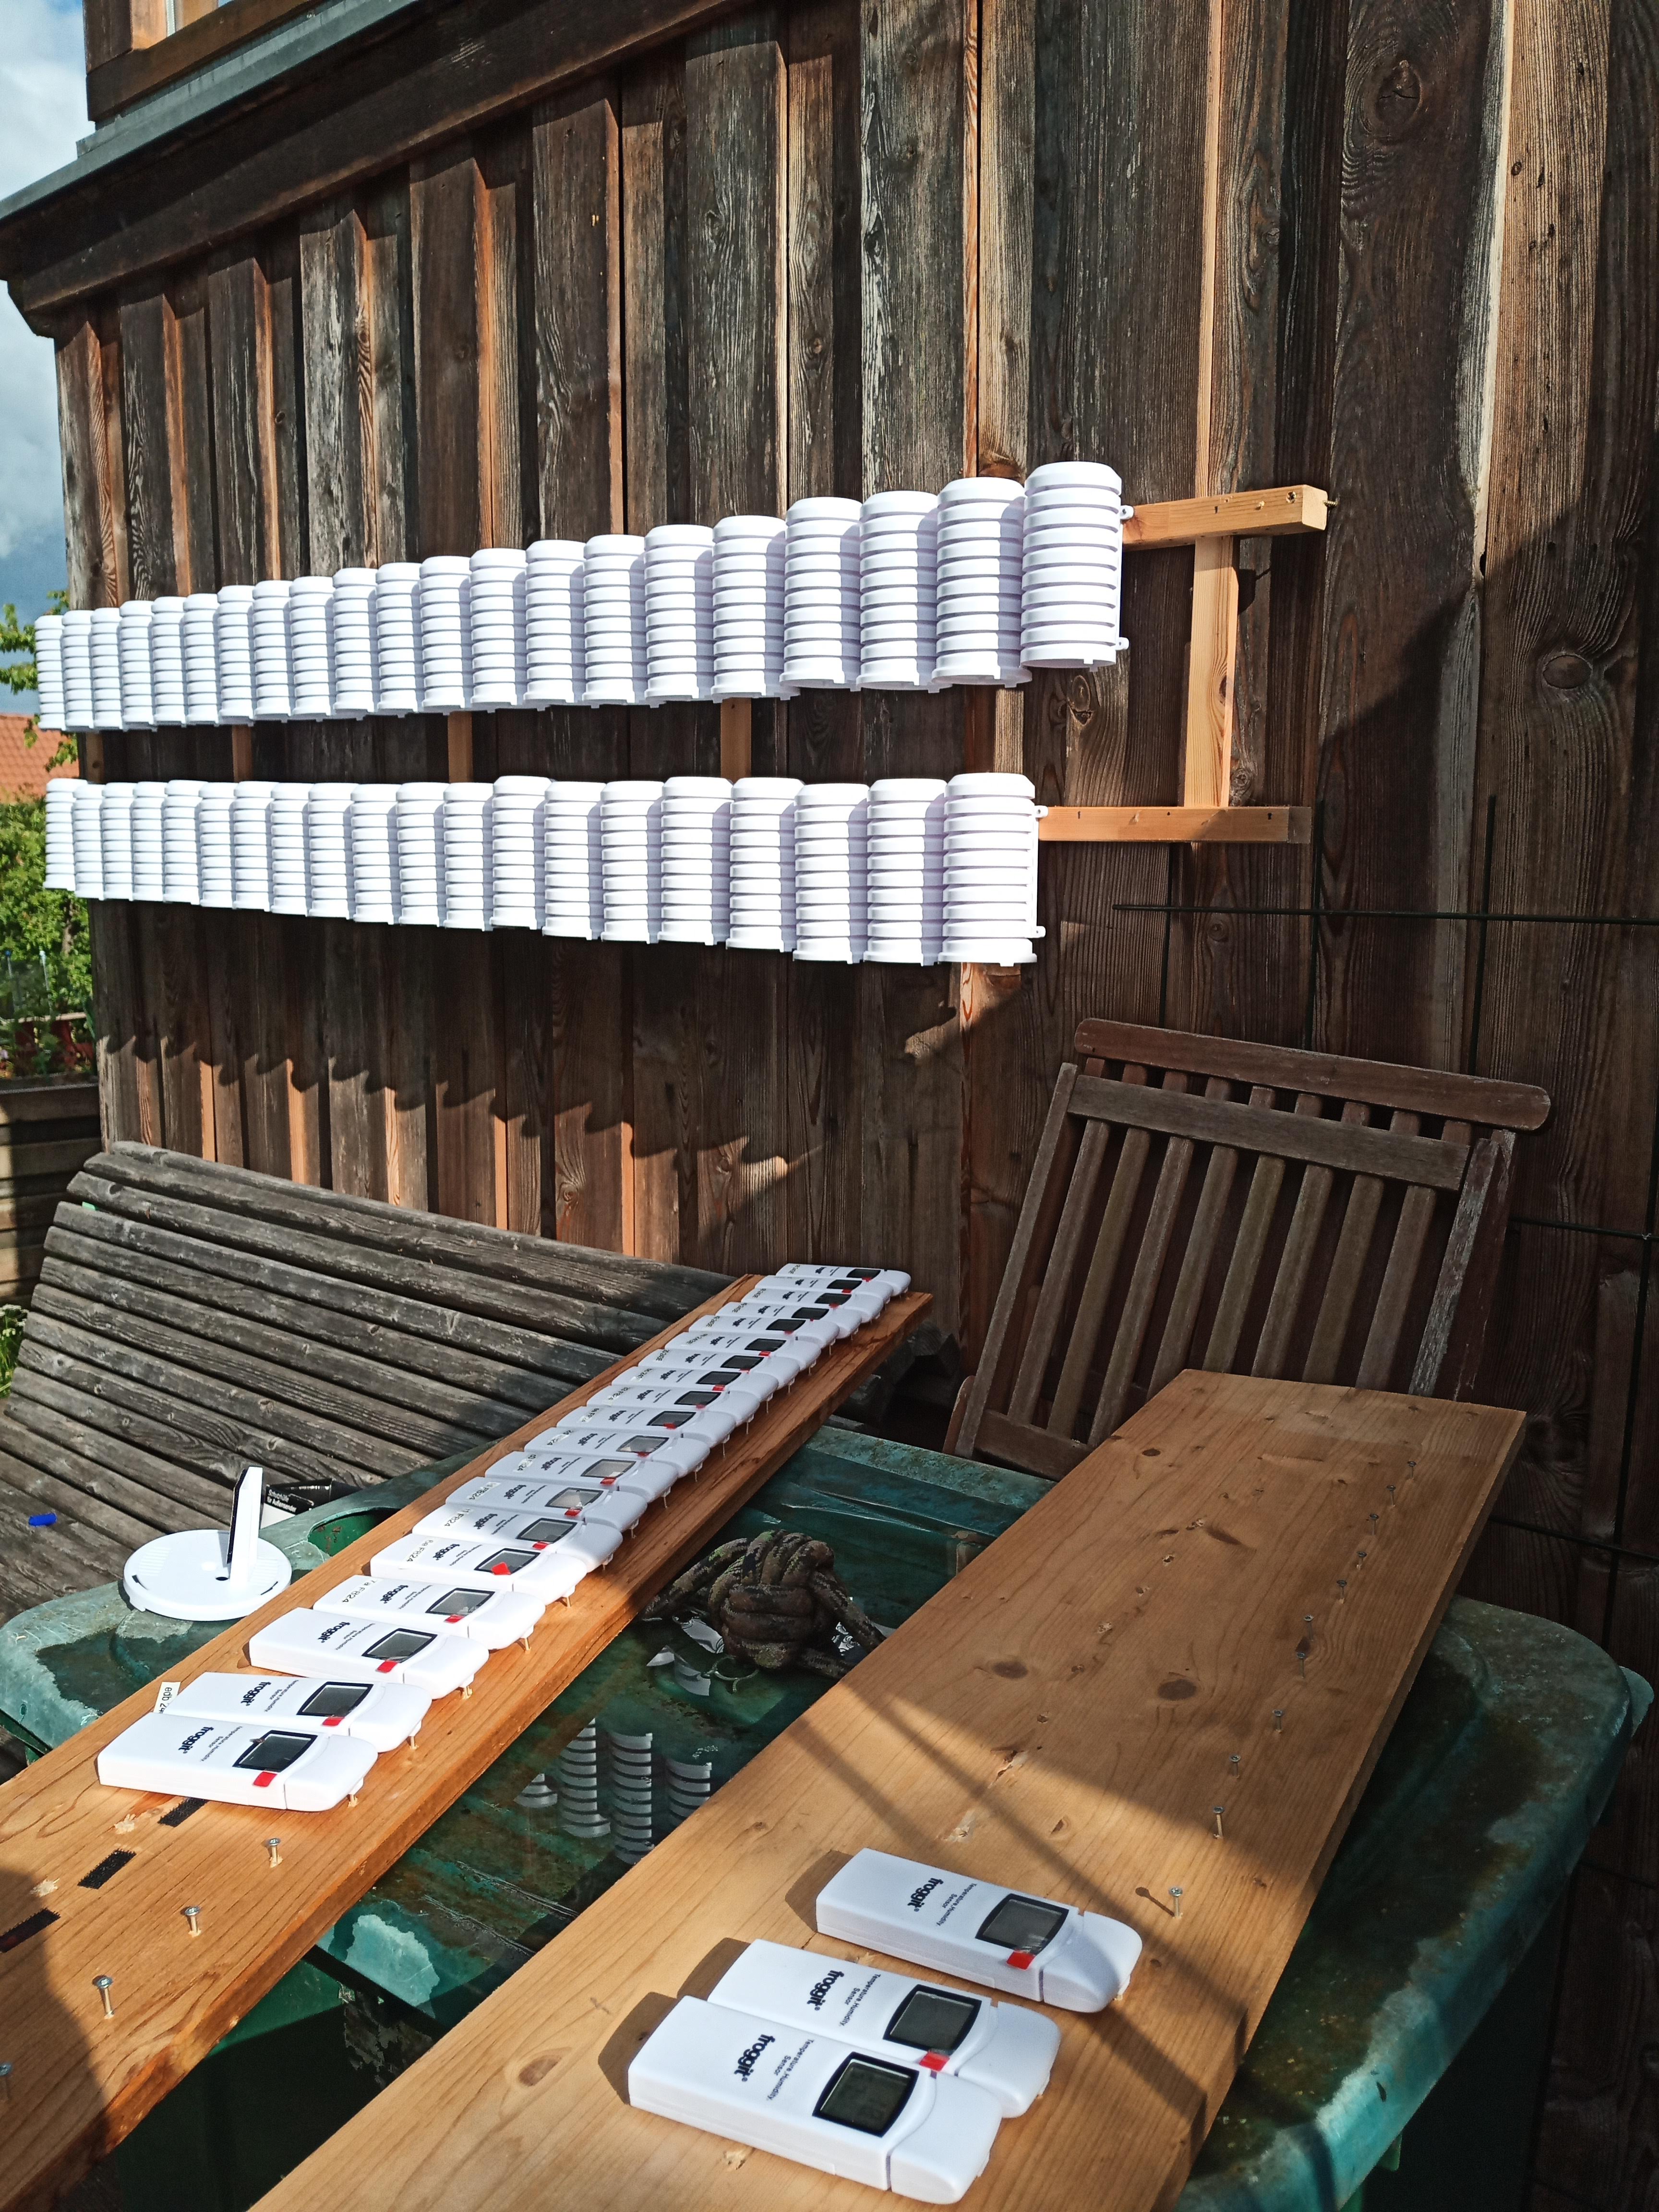

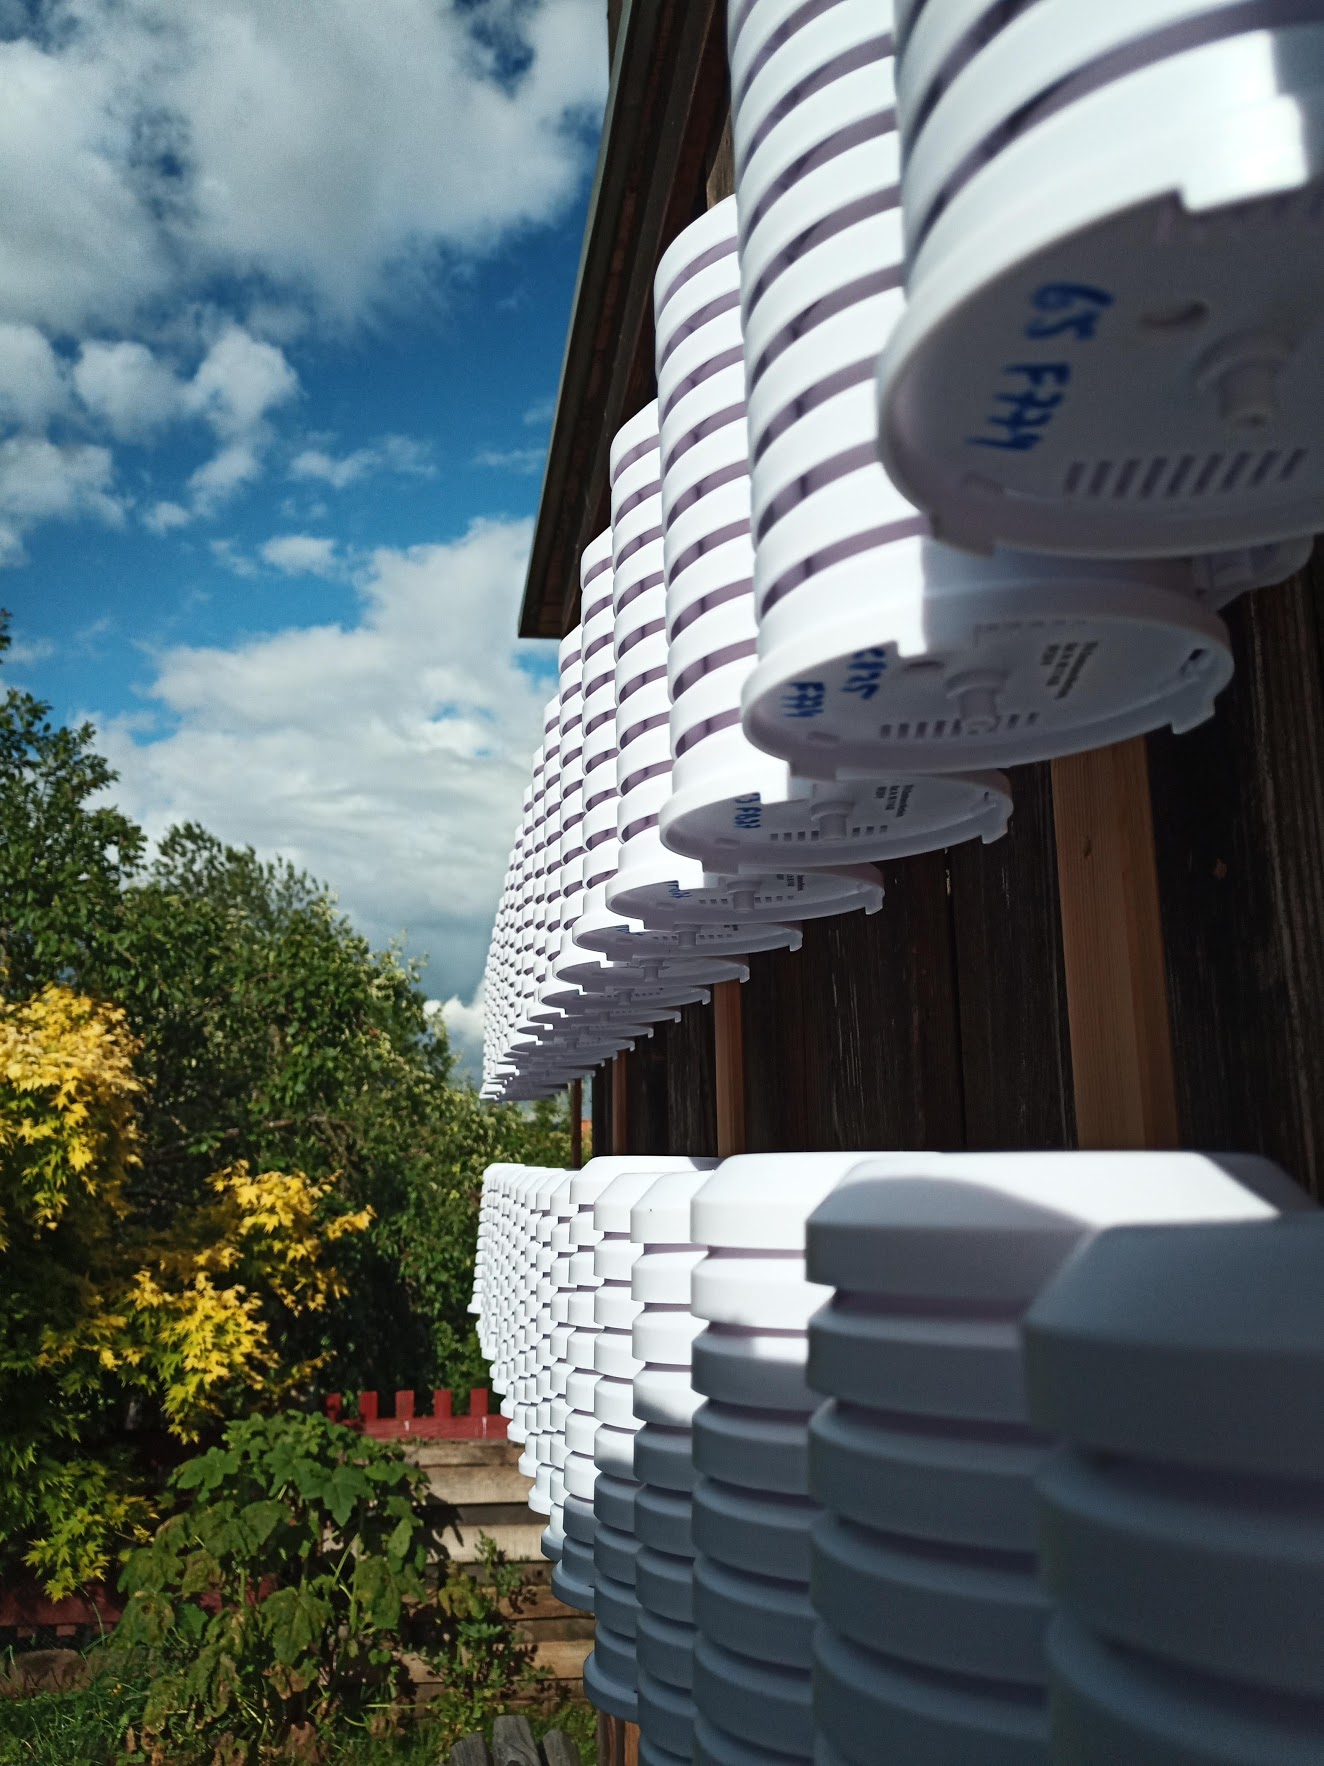
The 40+ sensors will be moved to the Campbell reference station in the Marburg Open Forest at the beginning of week 24, where calibration phase 2 will start.
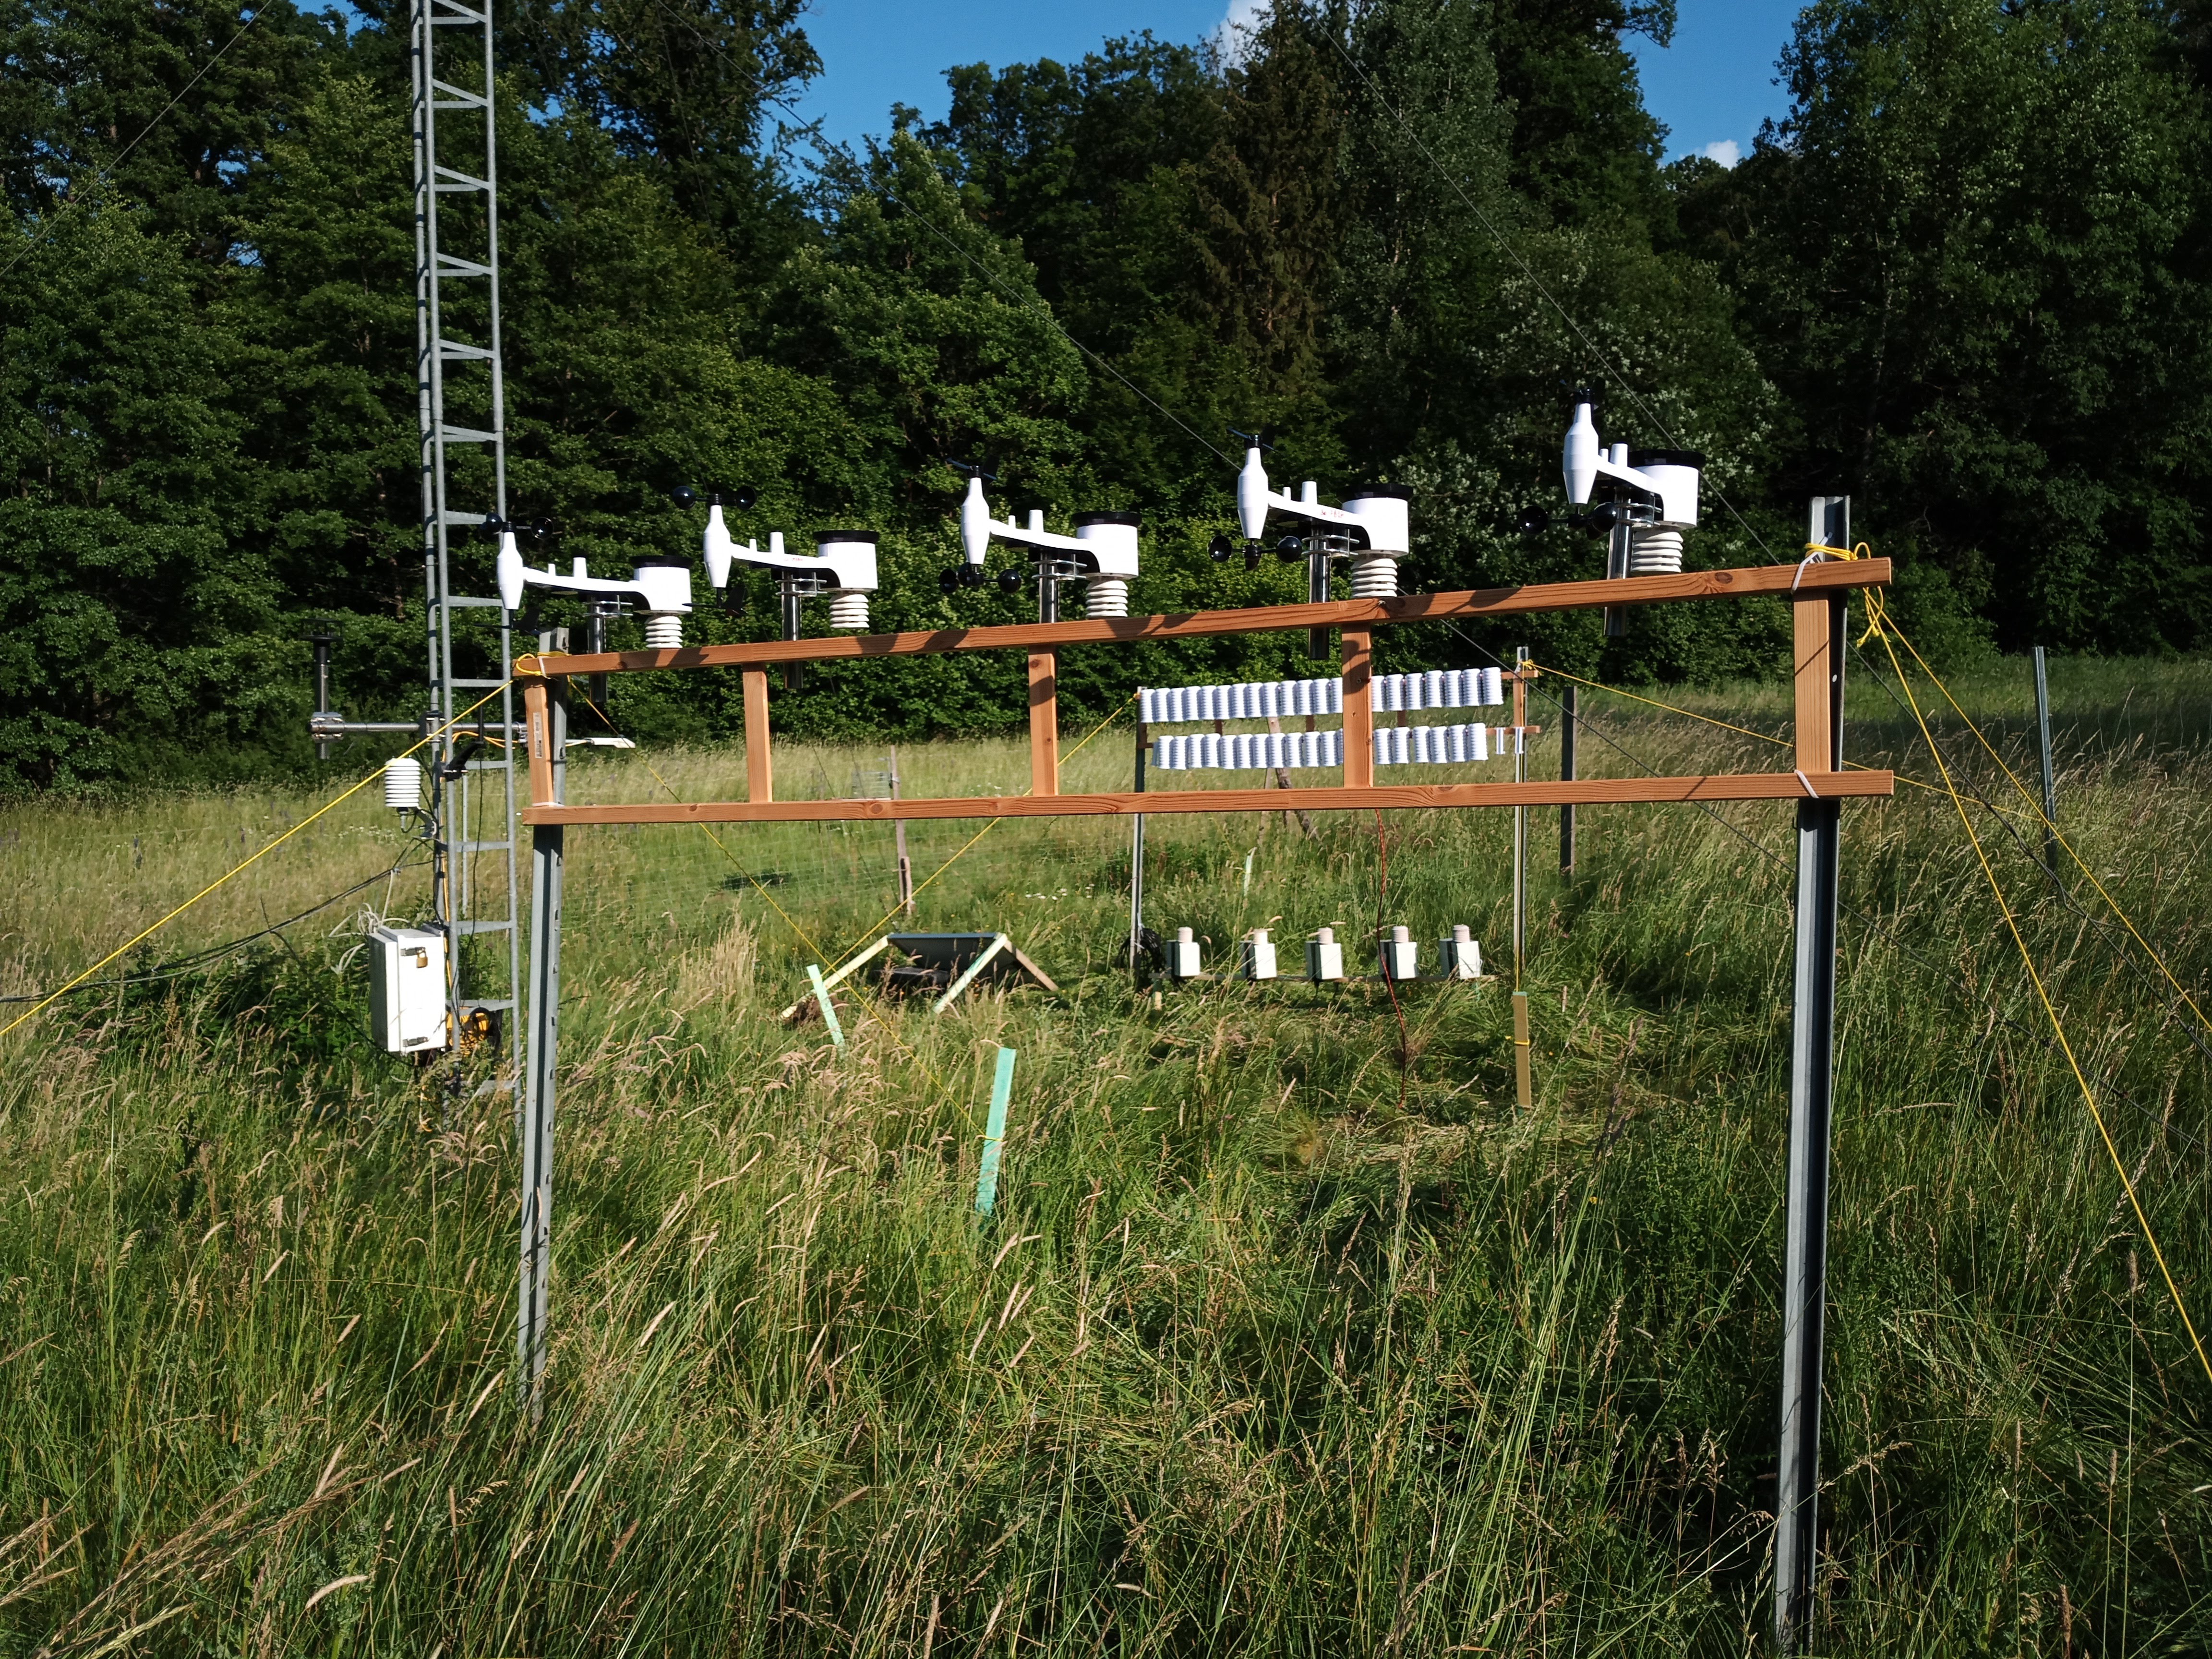
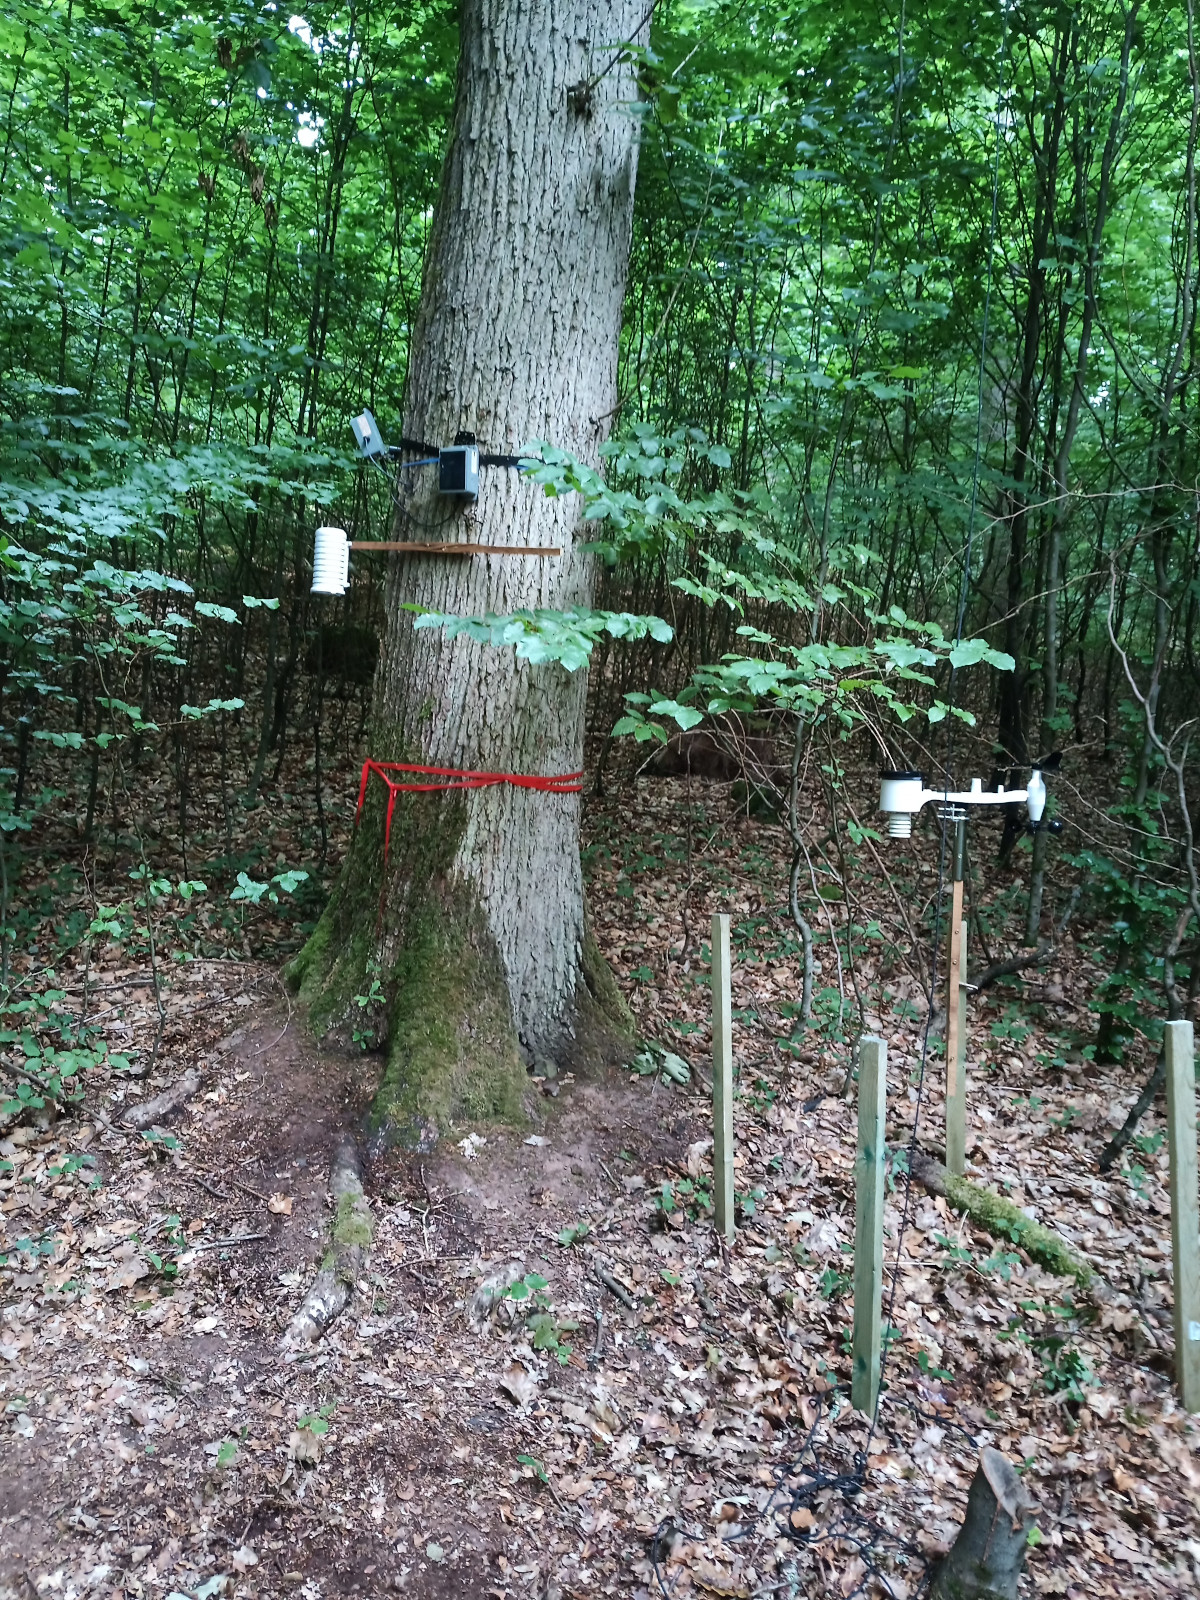
Field Calibration
The current deployment situation of the Micro-Climate-Sensors is shown on the map below. Currently we are running in a calibration mode.
More data is available by clicking on the station.
Full-screen version of the map
The field calibration step is finished.
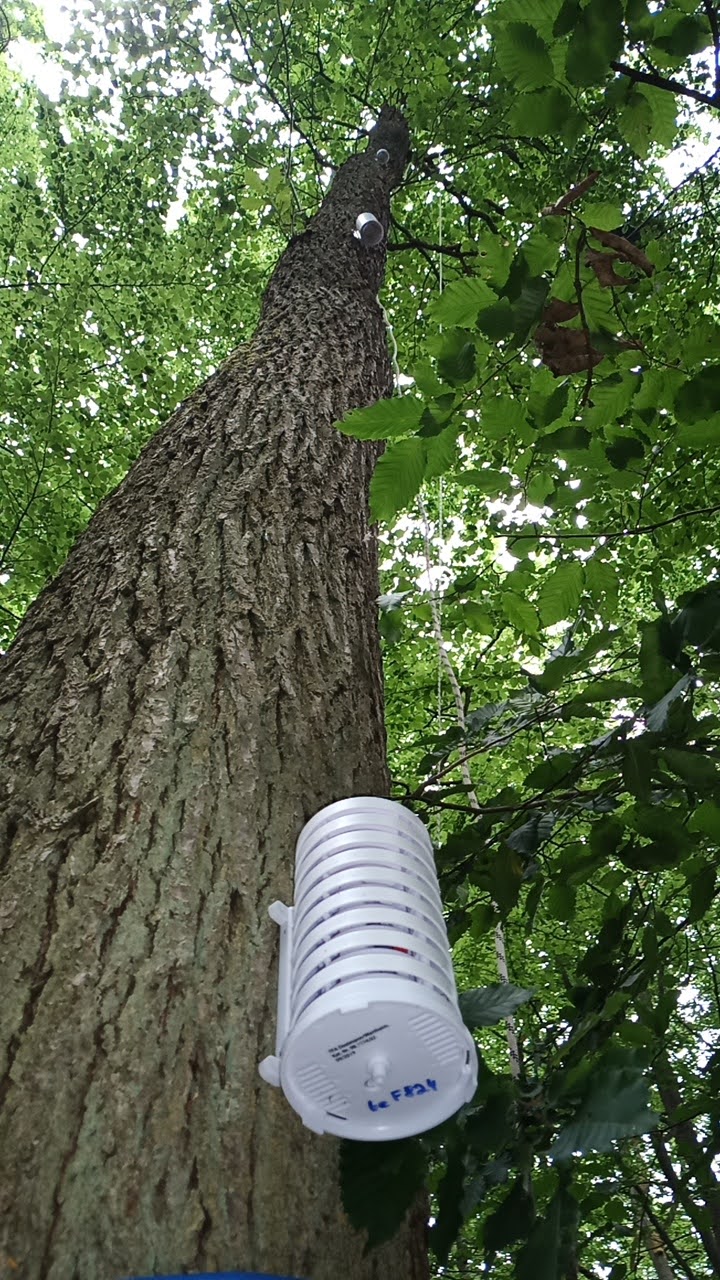
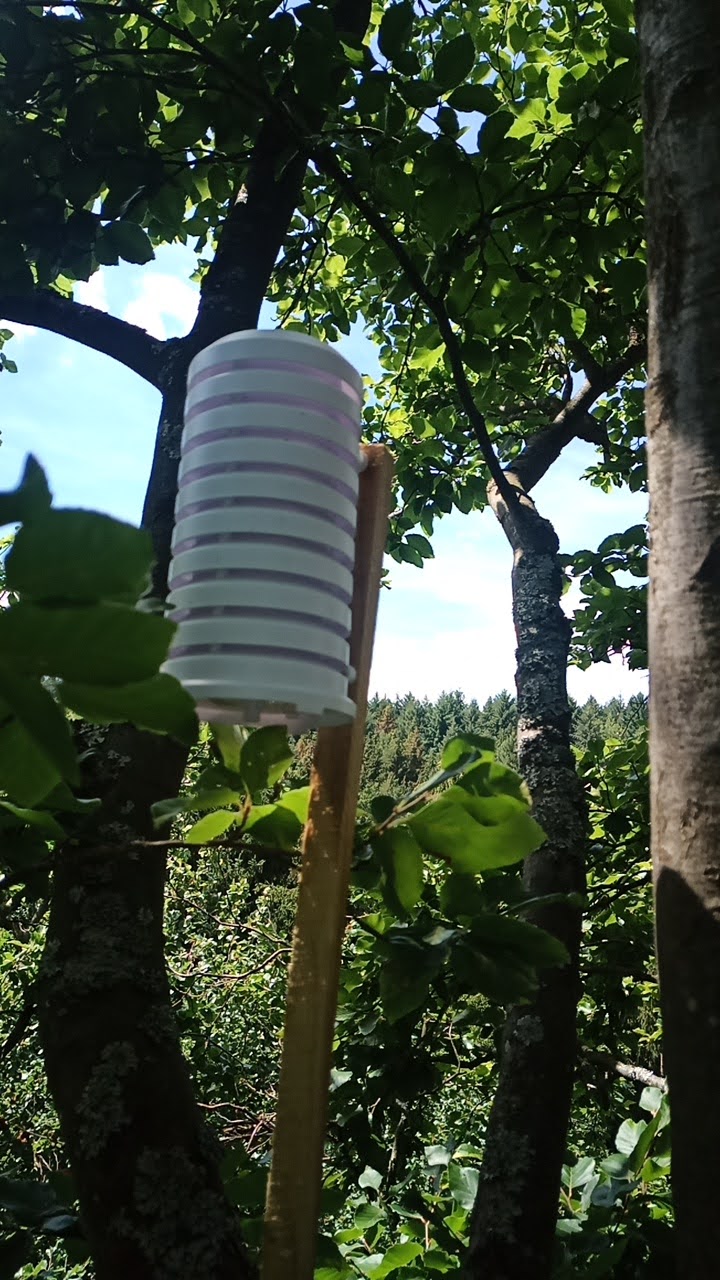
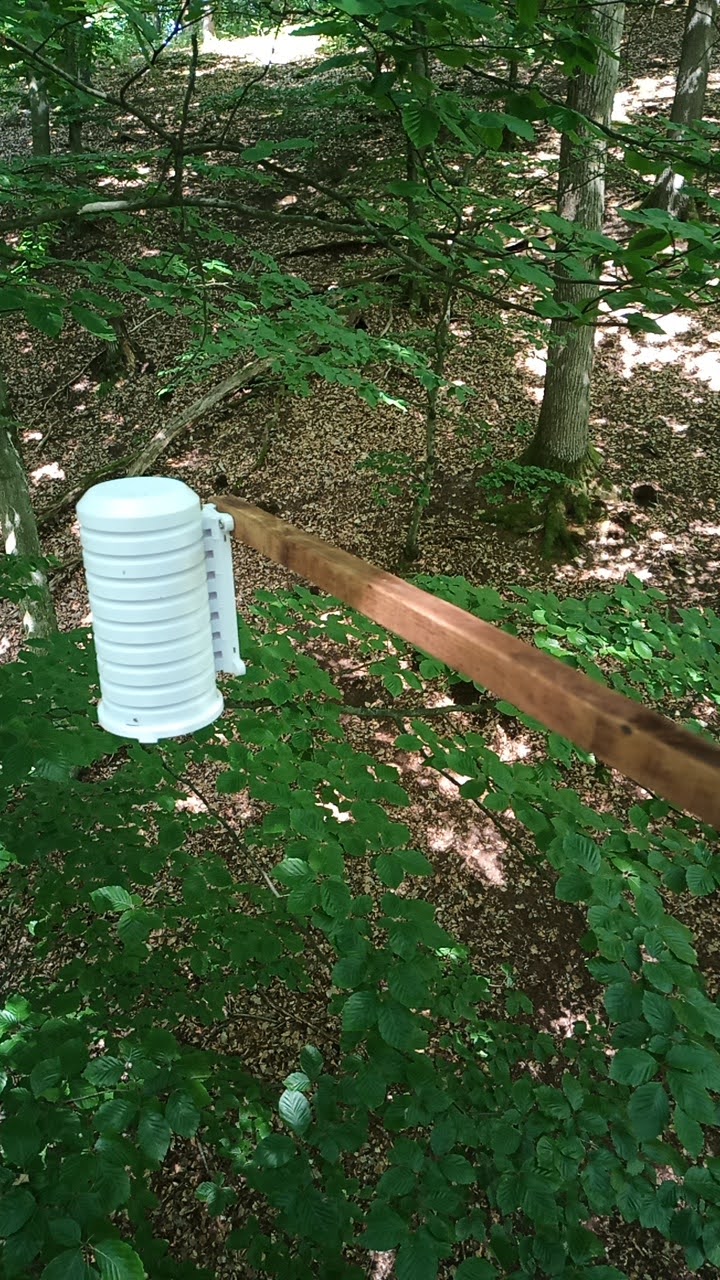
3D Tree Sensor Deployment
The equipping of the selected five core study trees with three-dimensionally distributed climate sensors is finished.


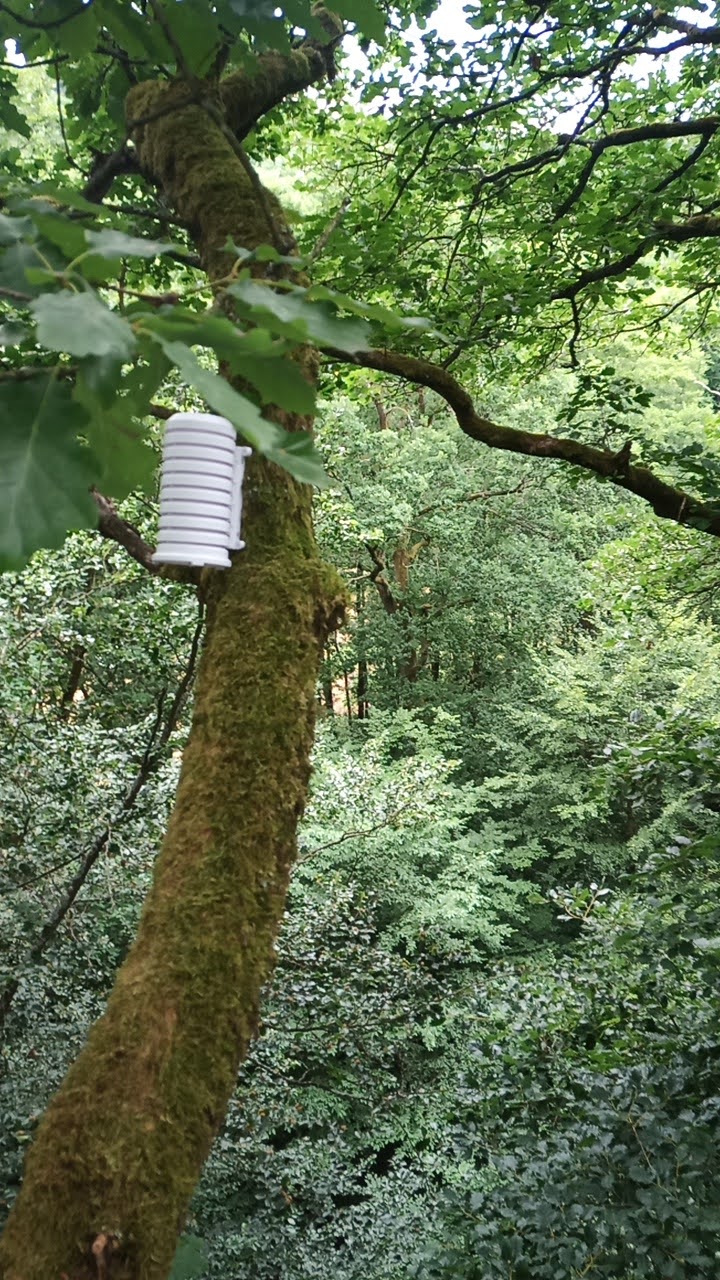
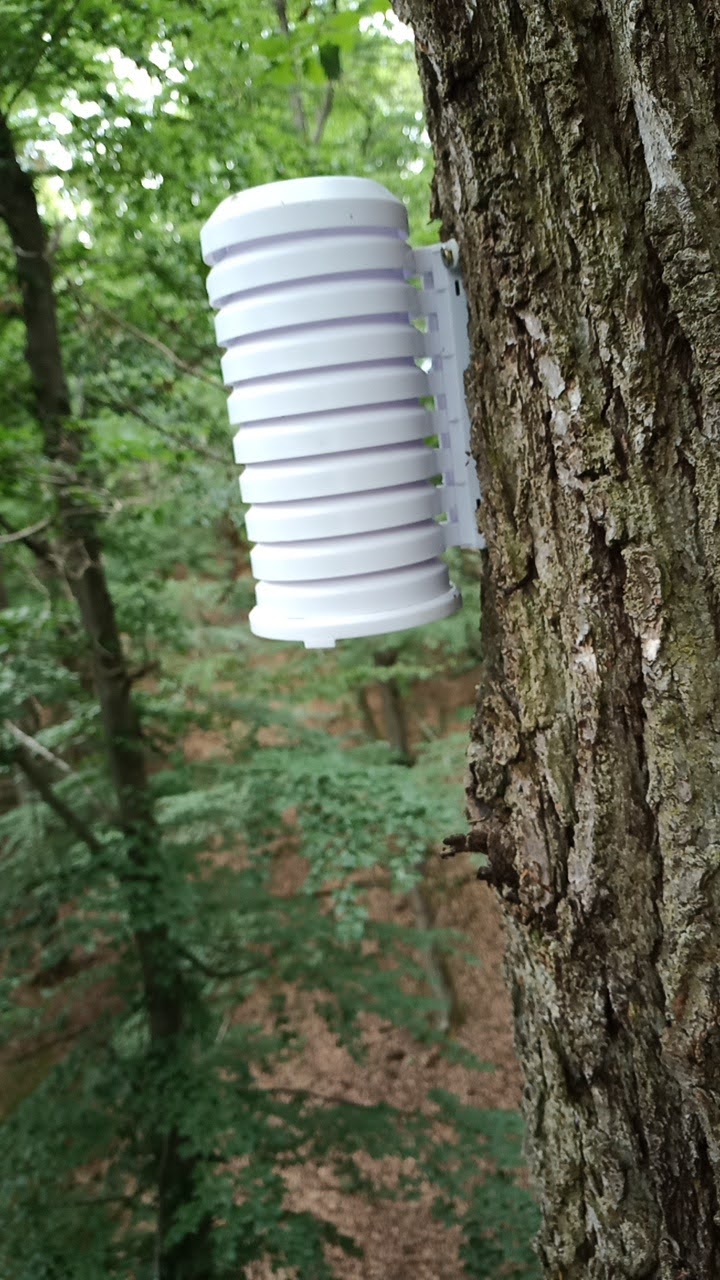

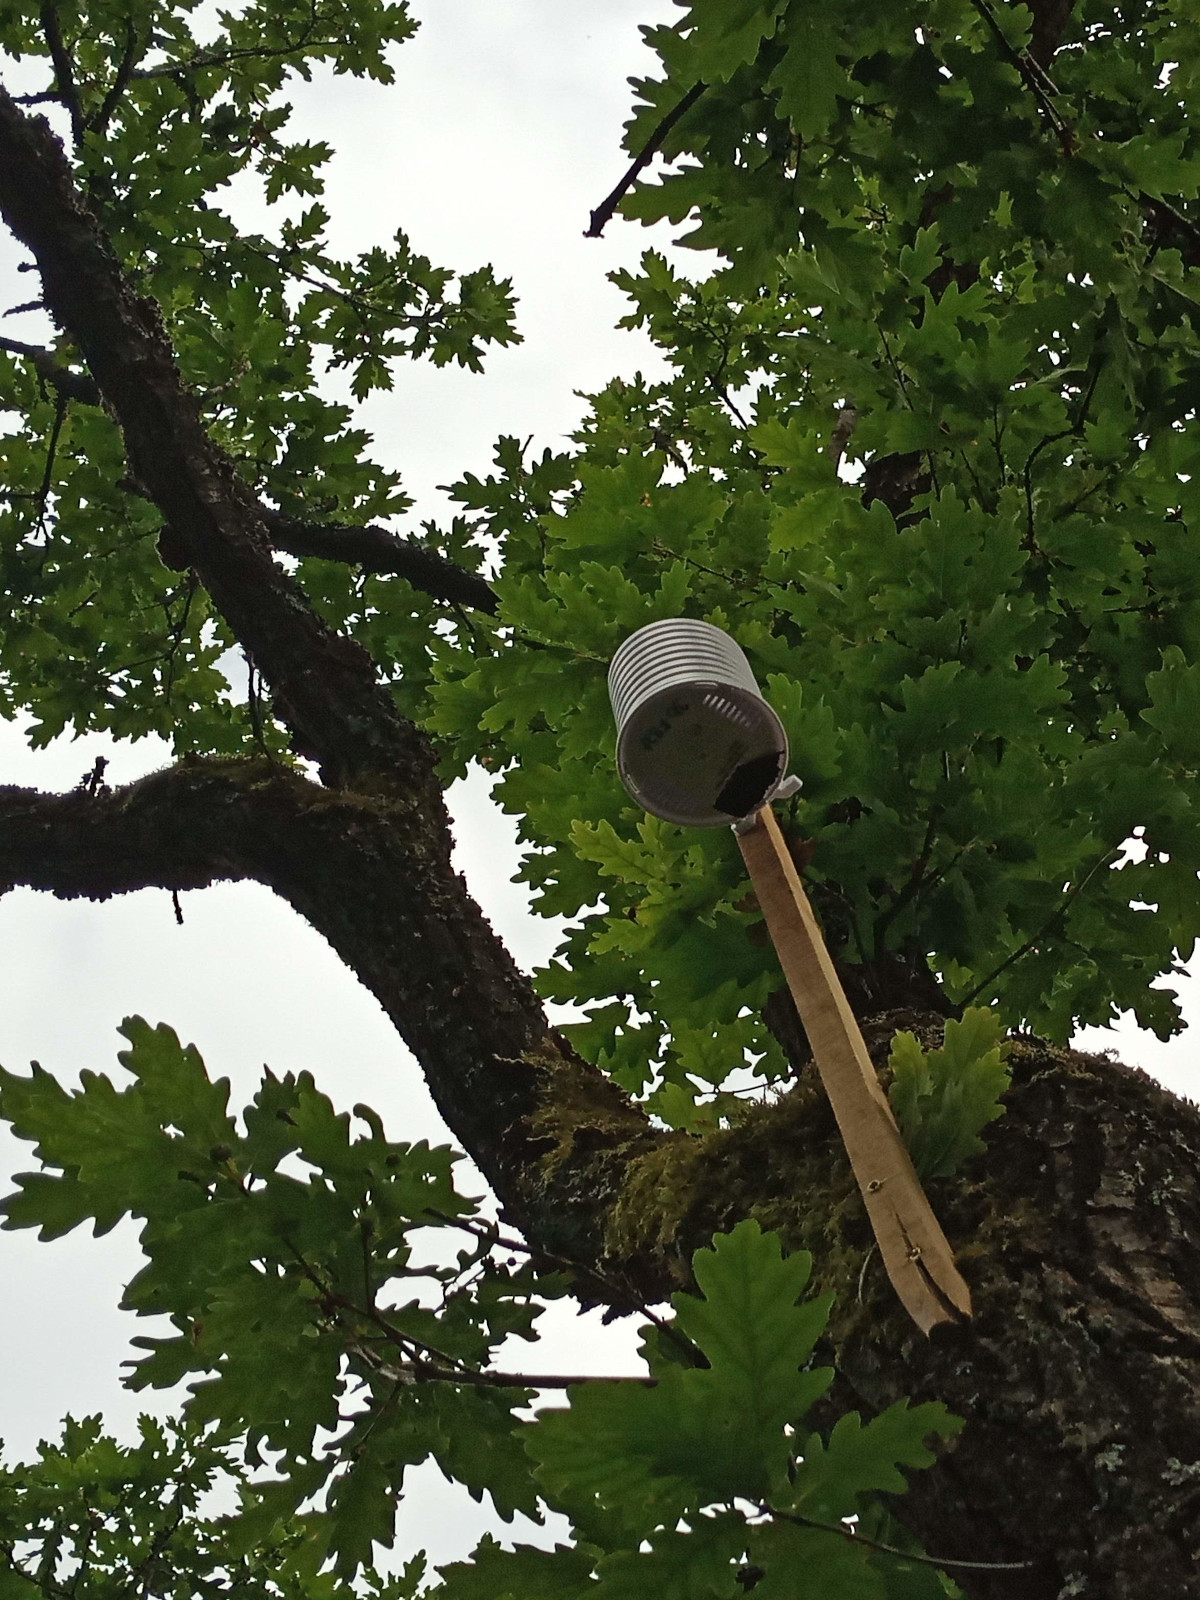
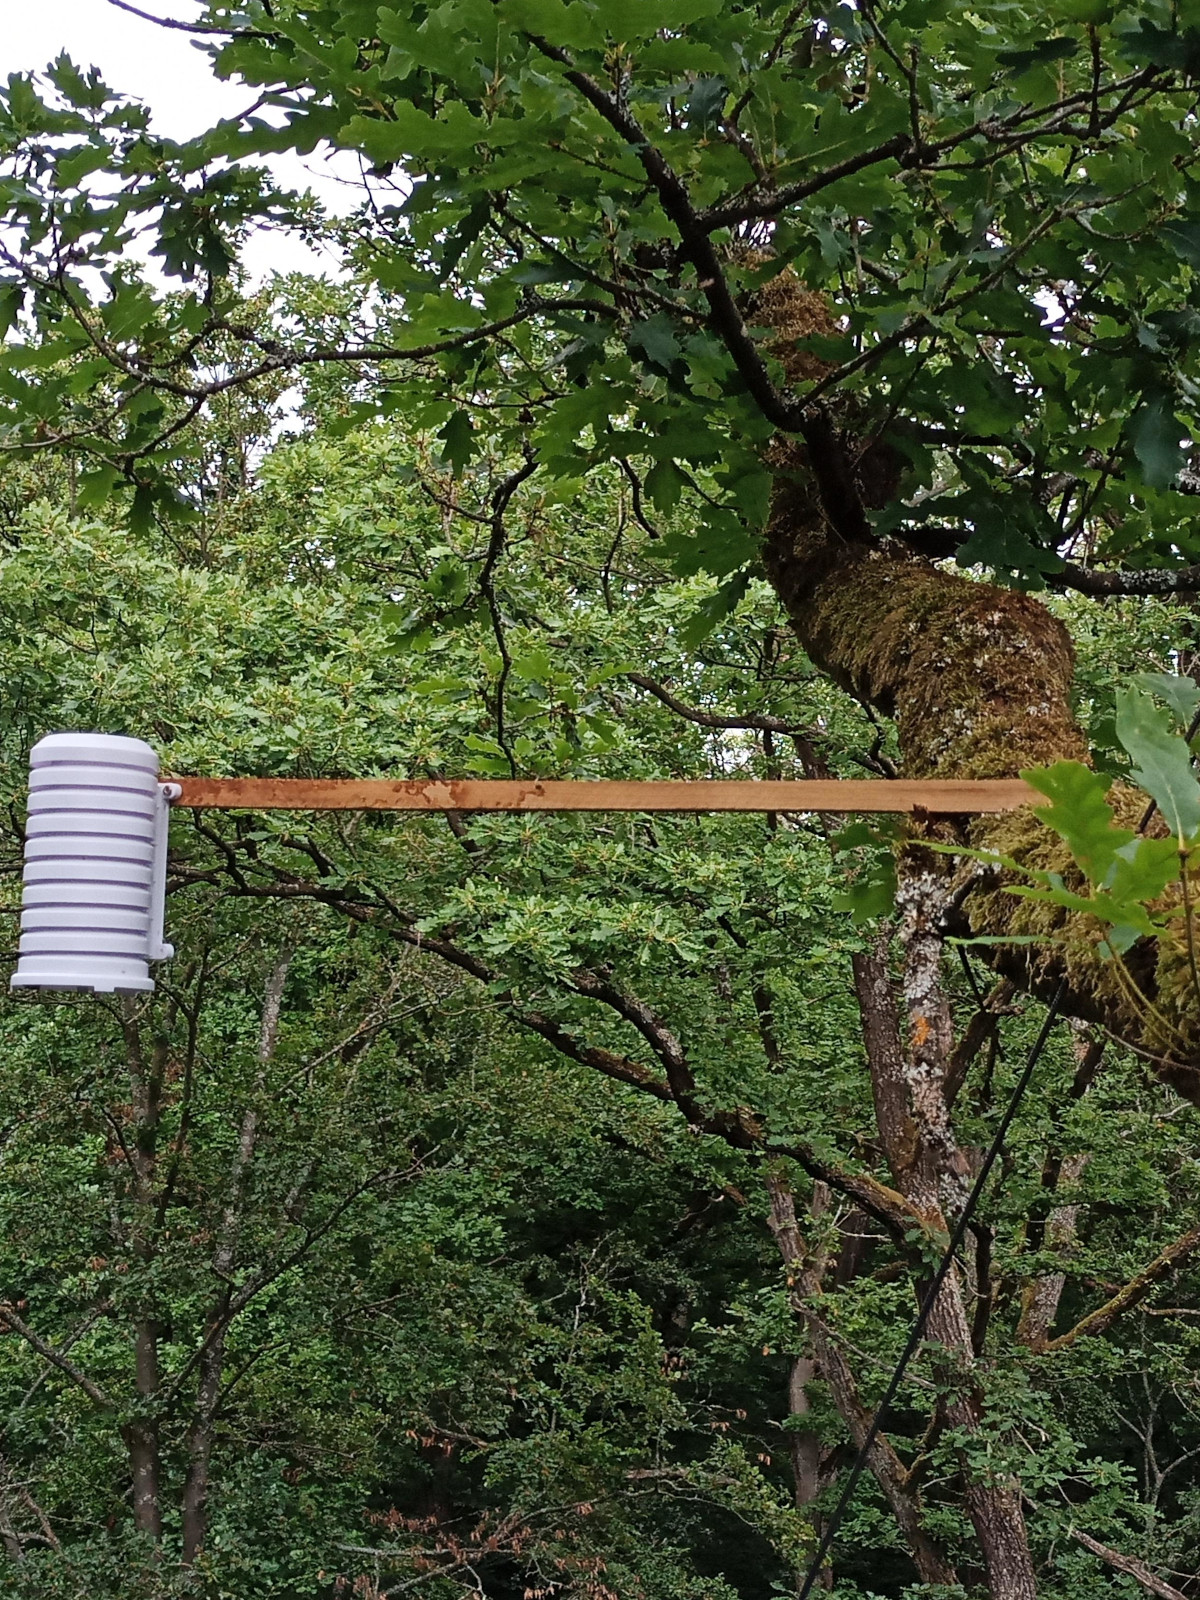
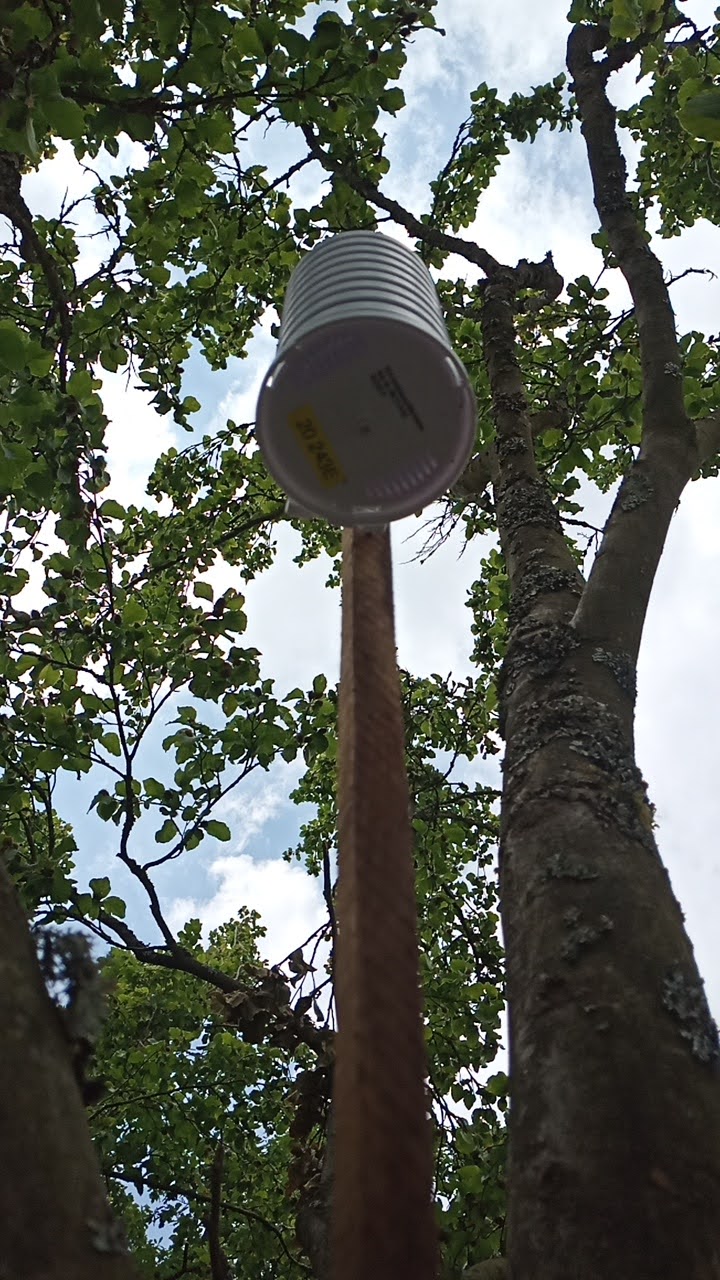

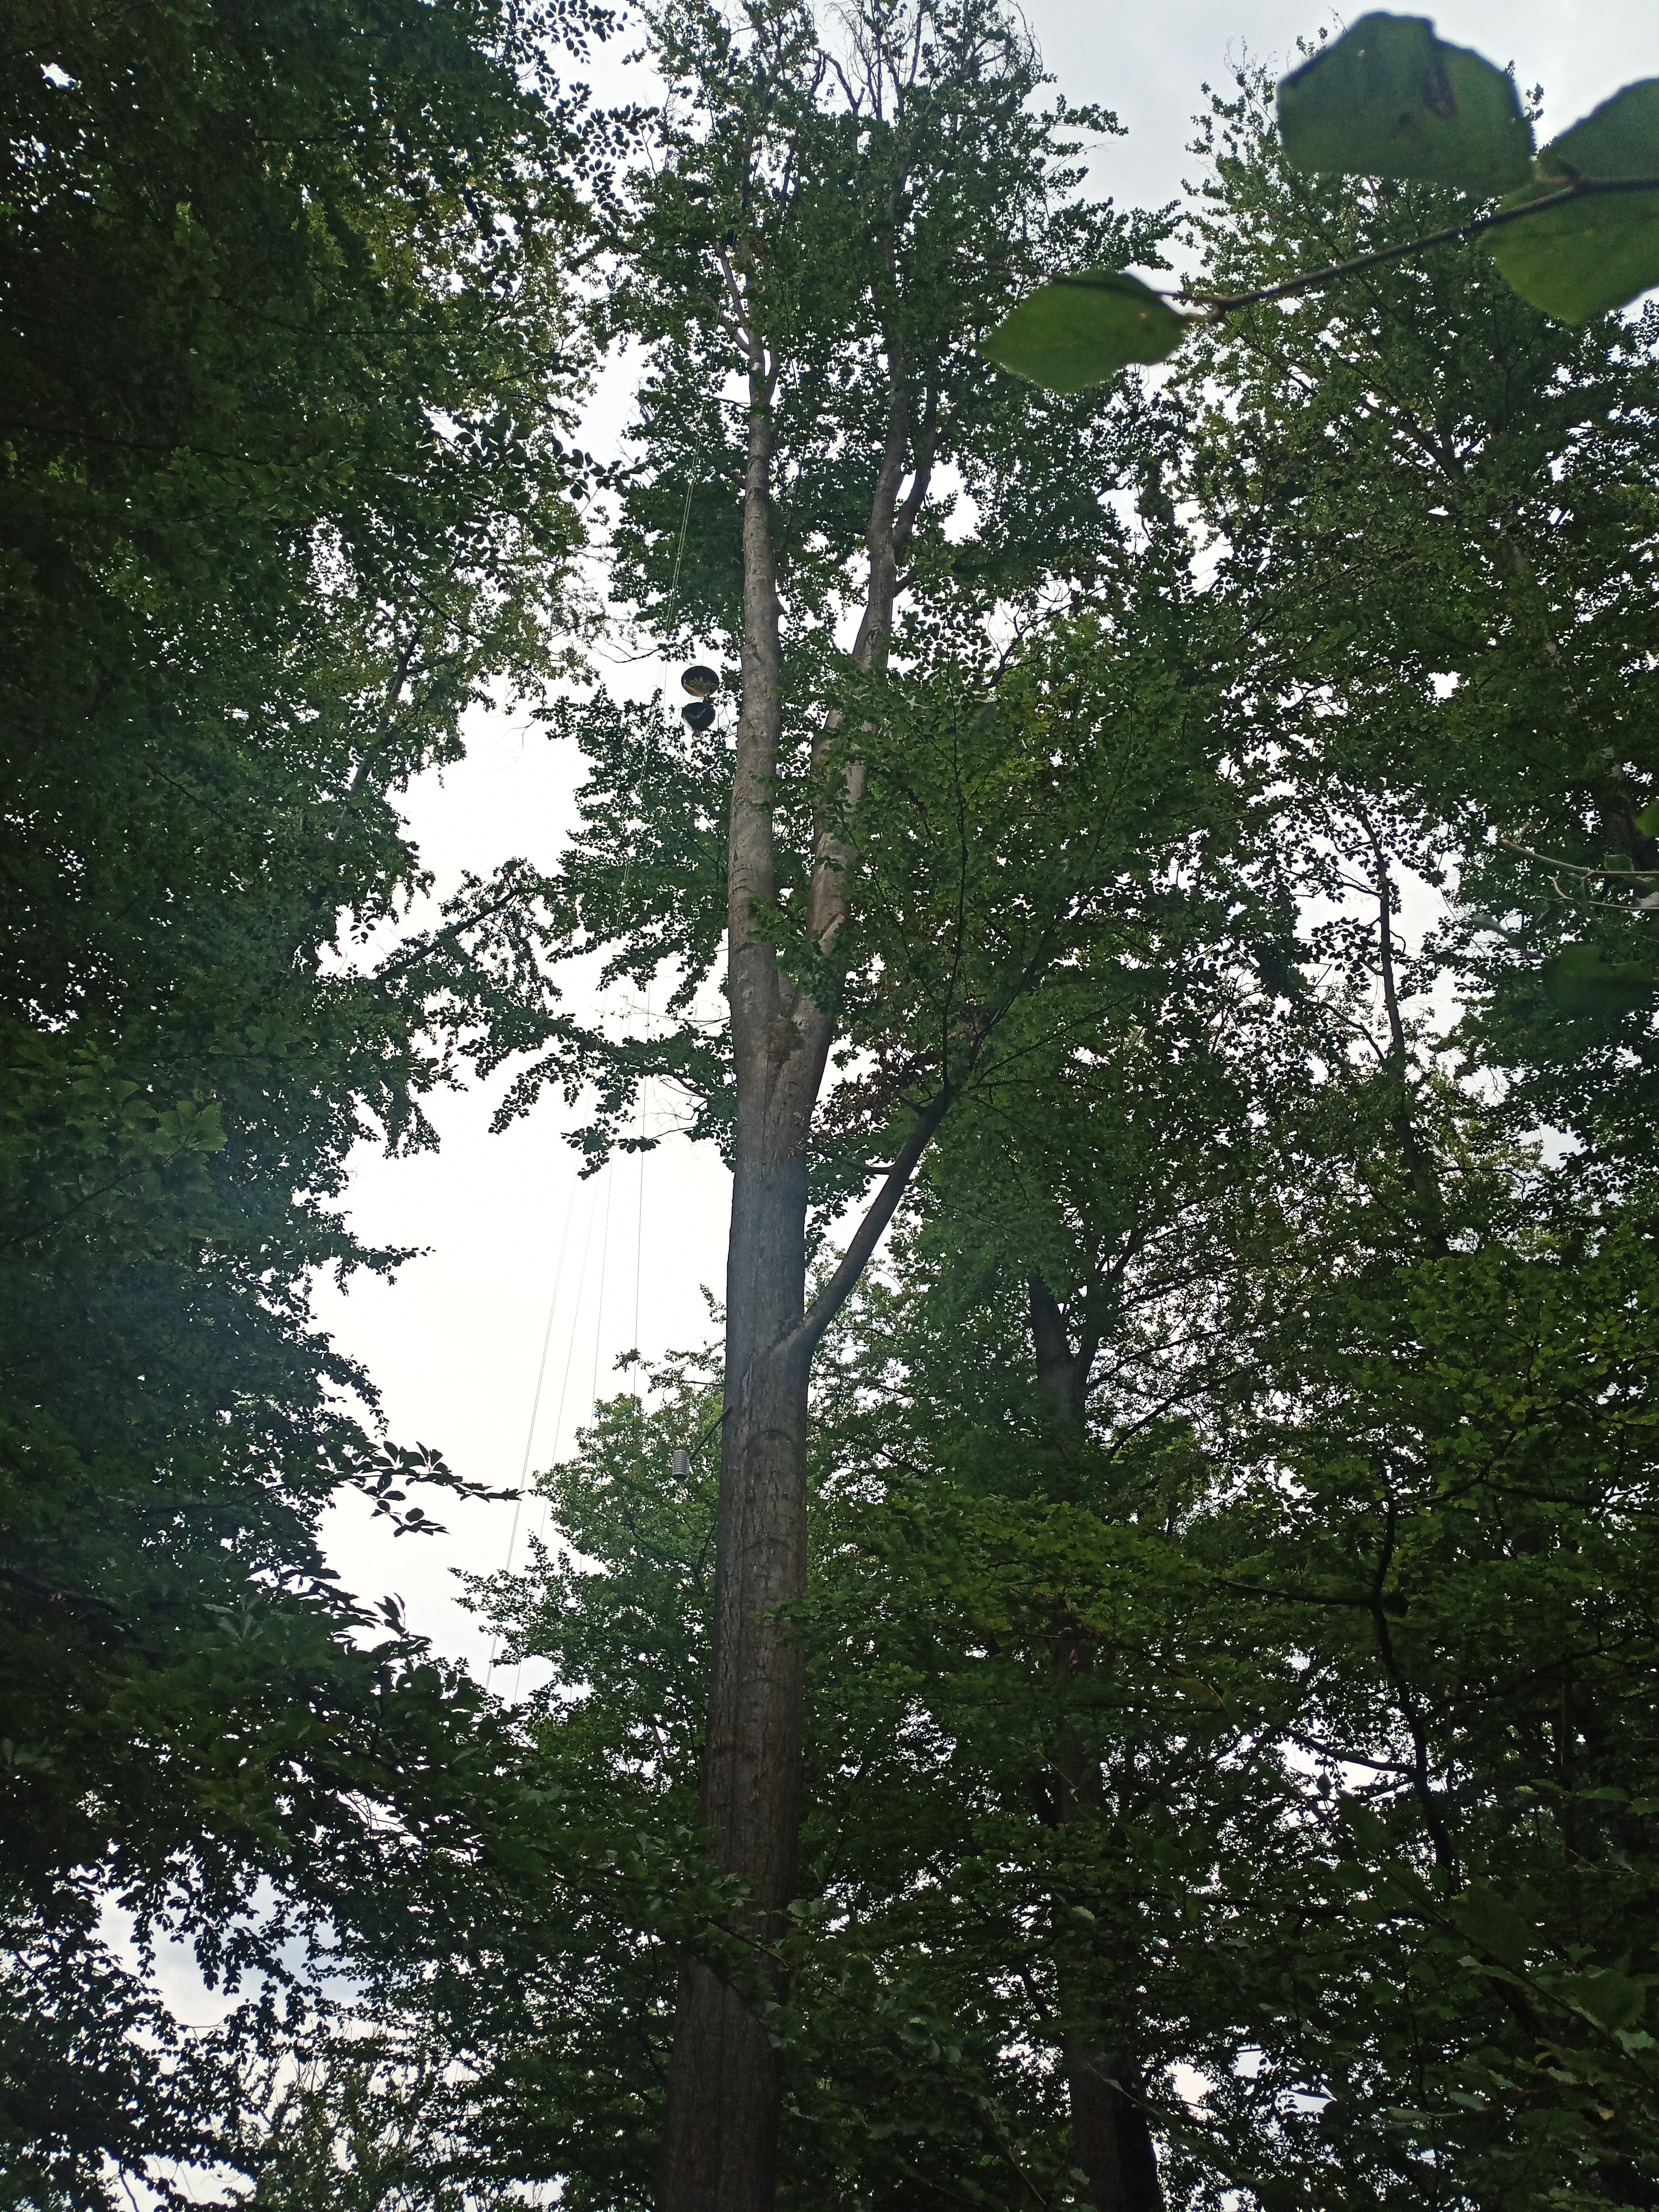
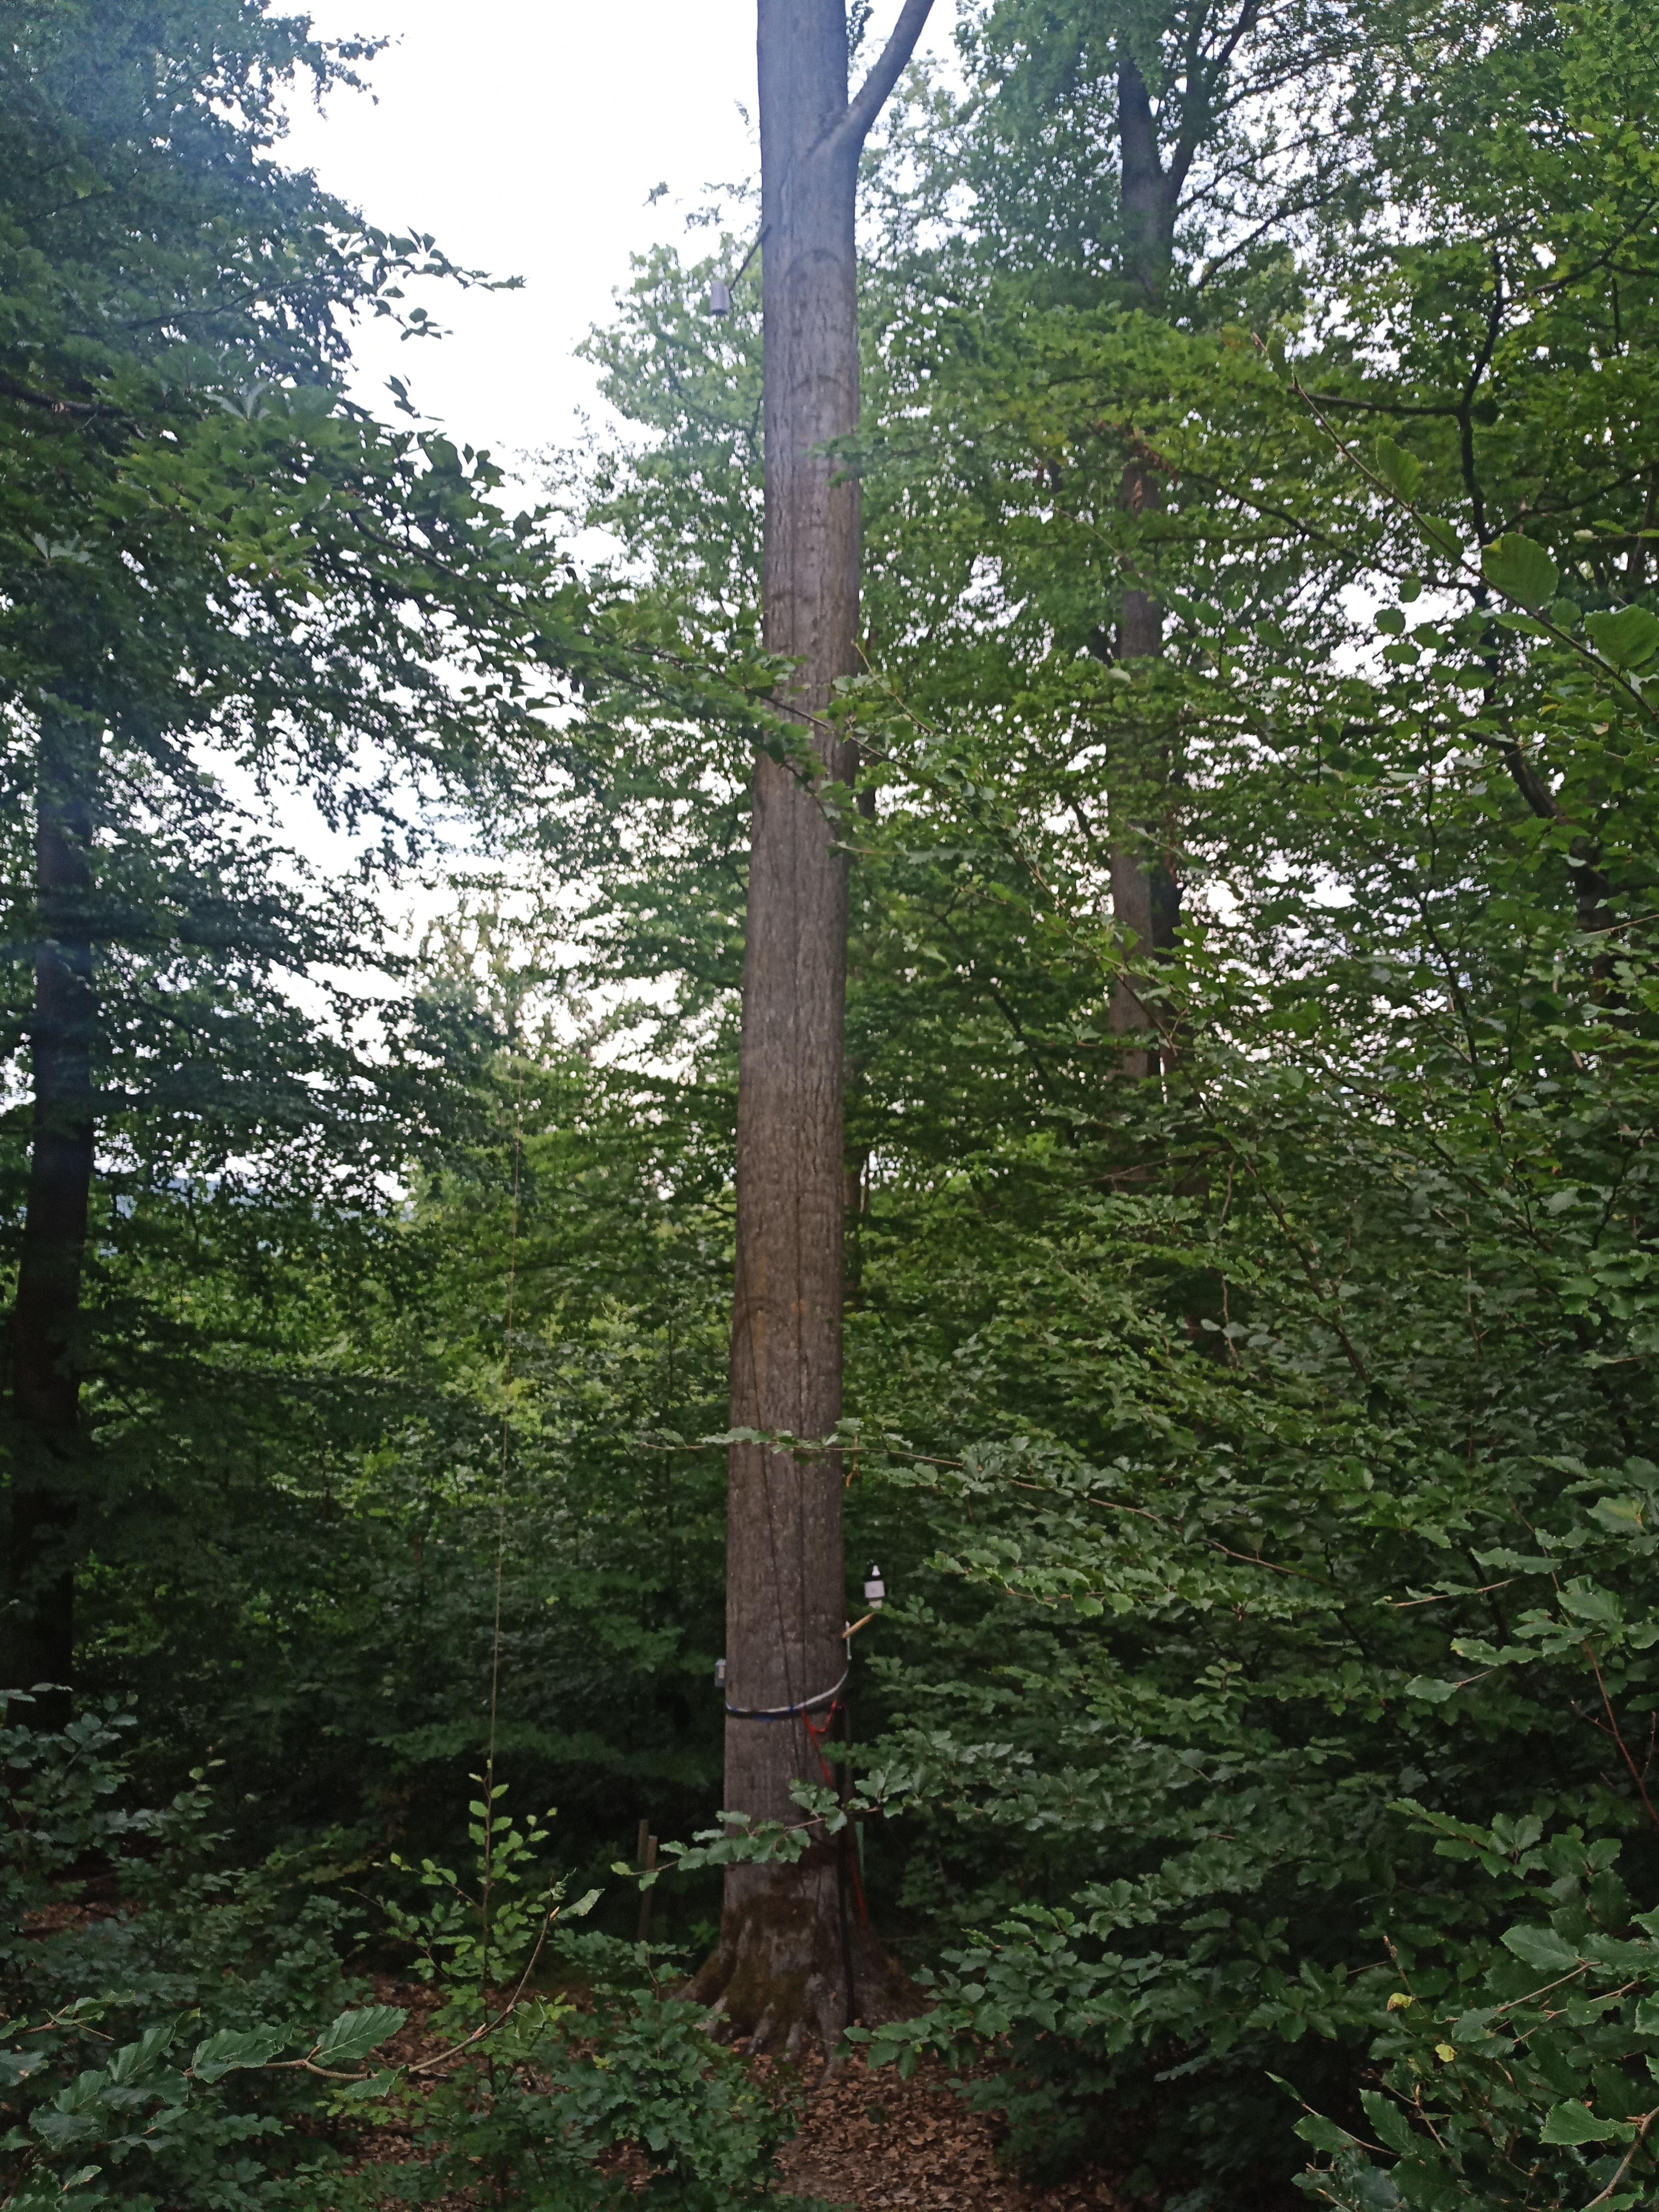

3D Climate Data
The sensors are running in the Marburg Open Forest. The core study trees that are shown on the underneath map. For a convenient overview please have a look at the ecowitt dashboard (need account). For the following core study trees (cst see also map below) you will find live data in a two minutes resolution:
- cst_0002 GW100A-WIFIF774
- cst_0028 GW100A-WIFI243E
- cst_0050 GW100A-WIFIFC29
- cst_0051 GW100A-WIFIFB27
- cst_0076 GW100A-WIFIF824
In additon the raw data stream is available via the sensingbiodiversity server.
Note: The calibration phase was completed on July 12 (2020). At this stage, the data have not been checked or validated in any way.